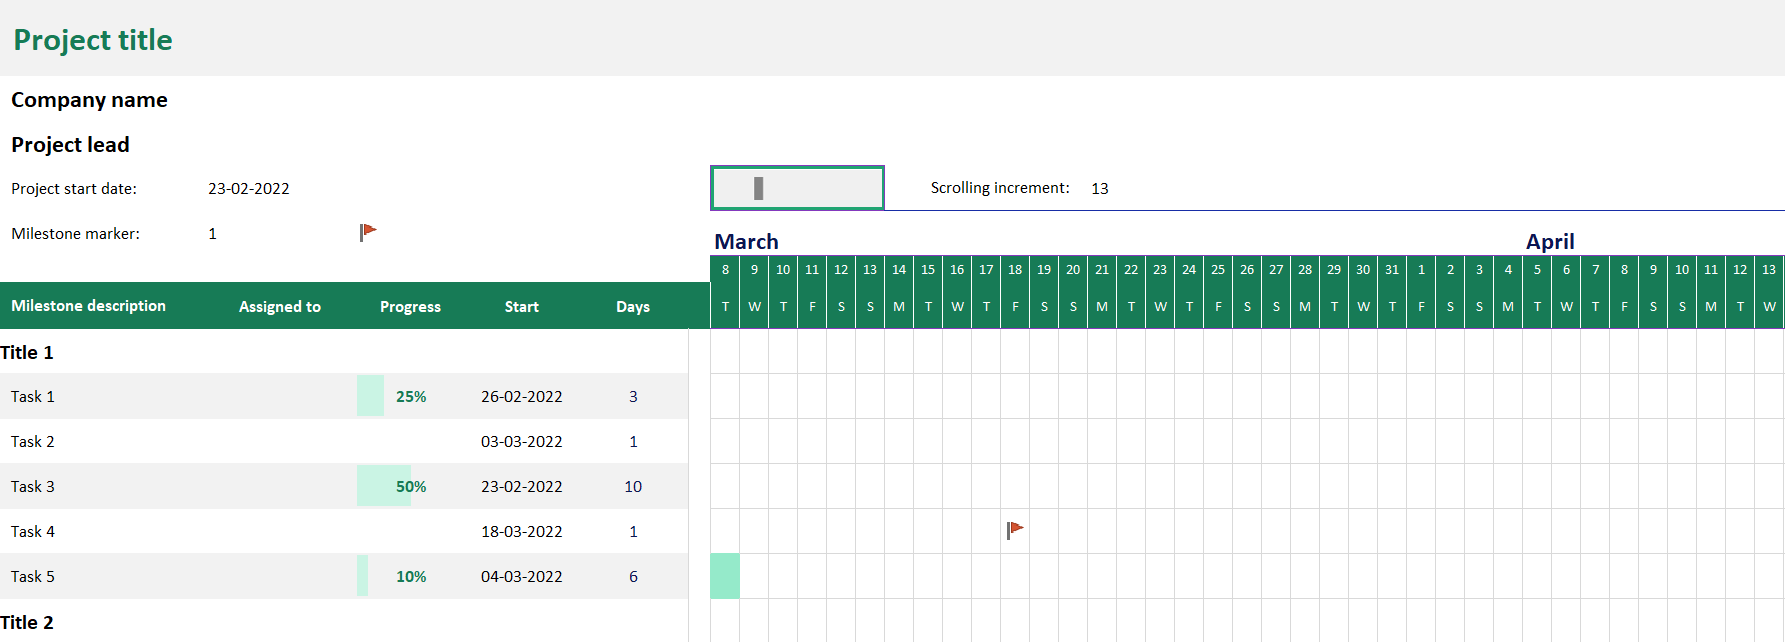
A Date Tracking Gantt chart is a project management tool that helps in planning, scheduling and monitoring an assignment. Using a date tracking Gantt chart helps with multiple tasks, including planning and scheduling, remote work collaboration, resource allocation and the balanced of tasks according to dates. However, A Gantt chart represents all information visually through a horizontal bar graph. Project managers and team members can view the task schedules, dependencies and progress by just glancing at the date chart.
Planning and adjusting dates for all tasks in advance and making them visible in one place empowers teams to deliver assignments on time. For instance, This date chart displays the start date and duration of each task that makes up a project. It is one of the most popular projects management tools because it enables project managers to view the progress of an assignment at a glance. It also makes it easy for project managers to identify the critical path to project completion and ensure that there is no delay in those tasks.
How to Create a Date Tracking Gantt Chart in EXCEL
Visualize and Track your Assignments over a timeline with this accessible date-tracking Gantt chart worksheet. This date chart template auto-updates when you enter your data. Use this date tracking Gantt chart worksheet to stay on track with milestones, dependencies and due dates. Also, you can customize the look of the Gantt chart tracker by changing formats, colors or other elements.
So, Before you create a Gantt chart, gather the following information:
- List of tasks
- Milestone Description
- Assigned To
- Task dependencies
- Team members allocated to each task
- Progress
- Date Description of Each Month
The underlying concept of a Date Gantt chart is to map out which task month can be done in parallel and which need to be done sequentially. By adding more resources or dependencies of the scope the assignment manager can see the effect on the end date.
Create an assignment table and Milestone Description-
start by entering your project’s data in an Excel spreadsheet. List each task in a separate row and structure your project plan by including the Start Date and End date.
Make an Excel Bar chart based on the Start date-
Select a range of your Start Dates with the column header
Add Progress data to the chart-
Now you need to add one more series to your Excel Gantt chart-to-be.
Add task descriptions-
like who is assigned for the assignments to the Gantt chart project. And add a monthly Description of the Project.
Improve the design and colours of your Excel Gantt date tracking chart
You can adjust colour, columns and designs as per your needs.
Why use a Date Tracking Gantt Chart?
Determine the initial assignment schedule – who is going to do what, when and how long will it take.
Allocate Funds and Resources – ensure everyone knows who is responsible for what.
Supervise and report progress – helps you stay on date and schedule.
Control and Convey the schedule – clear visuals for shareholders and members.
Display milestones – shows key proceeding.
Identify and report problems – As everything is depicted visually you can immediately see what should have been achieved by a certain date and, if the project is on a slow schedule, you can take action to bring it back on the path.
Projects planners also use Gantt charts to maintain their projects. In addition, they represent other things, the relationship between the start and end dates of tasks, milestones, and dependent tasks. Modern Gantt chart programs are Free Advanced Roadmaps synthesize information and illustrate the deadlines.

