Insurance Quote
Introduction: Streamlining Insurance Quotations An insurance quote is a vital document in the insurance industry, serving as a preliminary estimate …

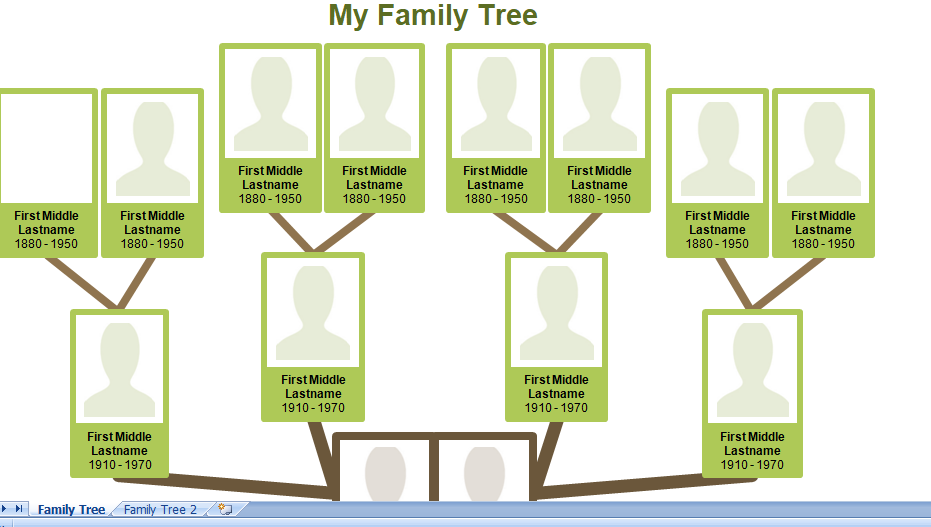
Family Tree Template: Unraveling the Ties that Bind Whether you’re a history buff, eager genealogist, or a school student given an interesting project, diving deep
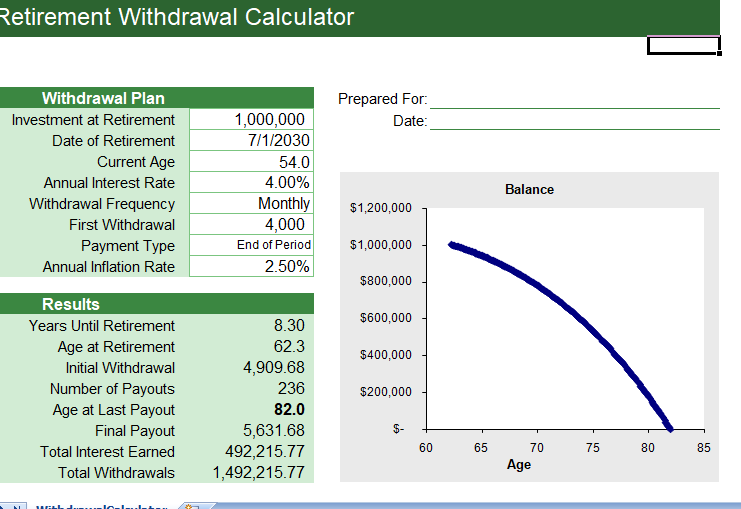
How much of your personal salary do you need to save to reach your retirement goal? That is not a simple question to answer, but
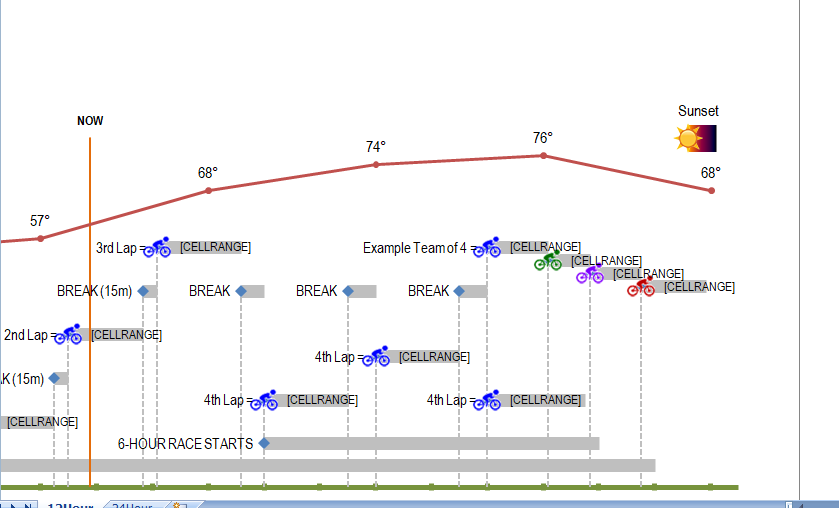
This Bike race timeline came within me because I love mountain biking, and I created it to figure out how to achieve some personal goals
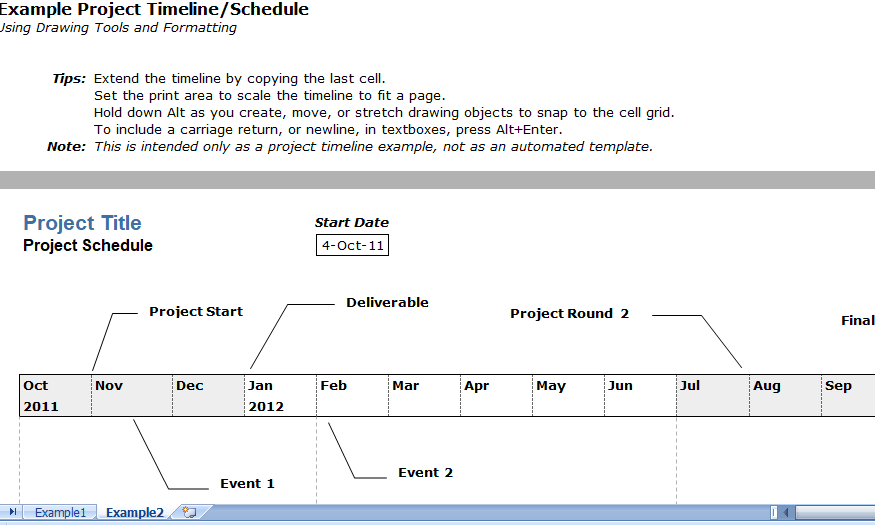
If you wish to use drawing tools to create a timeline. There is no limit to what you can create and how creative you can
A project timeline chart is created in Excel using charts linked to data tables, so that the chart updates when you edit the data table.
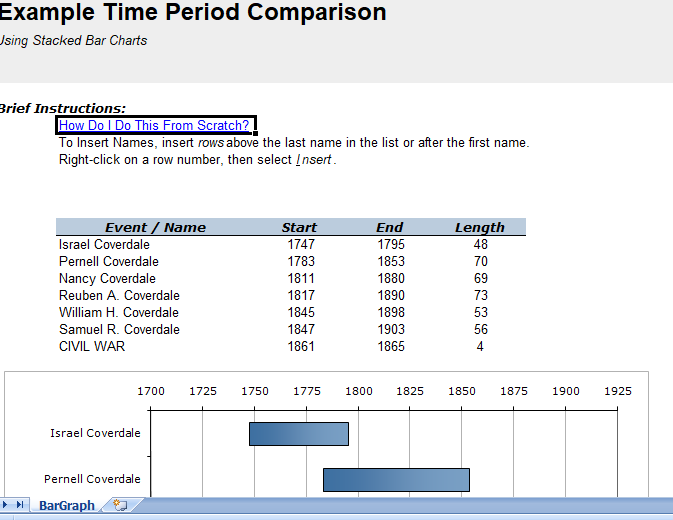
This timeline comparison is a useful technique to compare the value of a measure in different timeline periods. For example, we can compare the sales
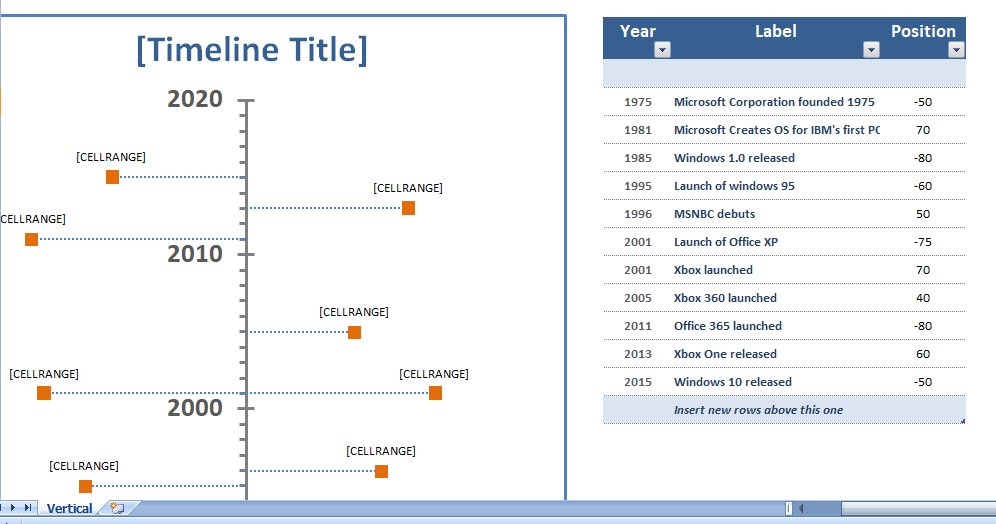
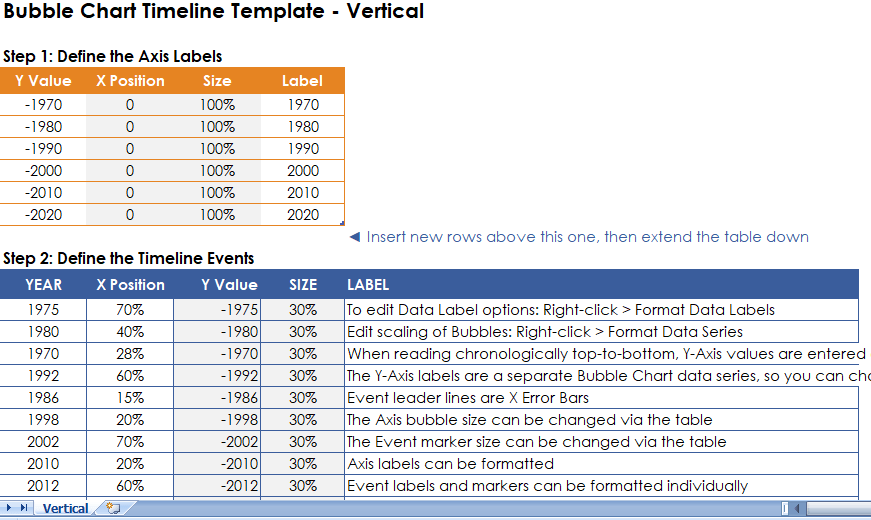
A vertical timeline is used in Excel using an X-Y Scatter Plot, Data Labels, and Error Bars for the leader lines. It include a feature
Are a small business owner or small-time lender wanting to track a line of credit? If you have tried our other line of credit calculator.
This spreadsheet is design for someone who want a simple way to track the value of their investment accounts over time. Every investment site or

You may use separate bank accounts for tracking different savings goals. Also for holding funds for annual expenses like taxes and insurance payments. If not,
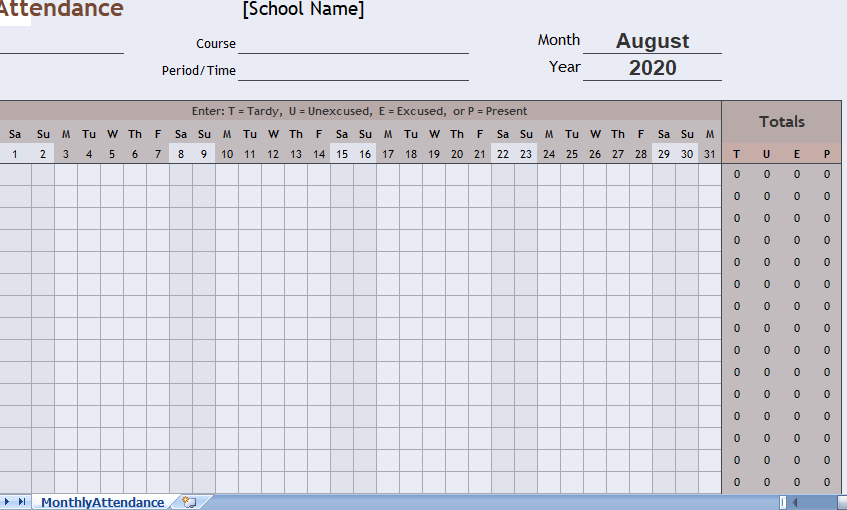
Most schools and businesses track attendance using spreadsheets. Monthly class attendance sheet are helpful for blank attendance forms that you complete by hand, or you
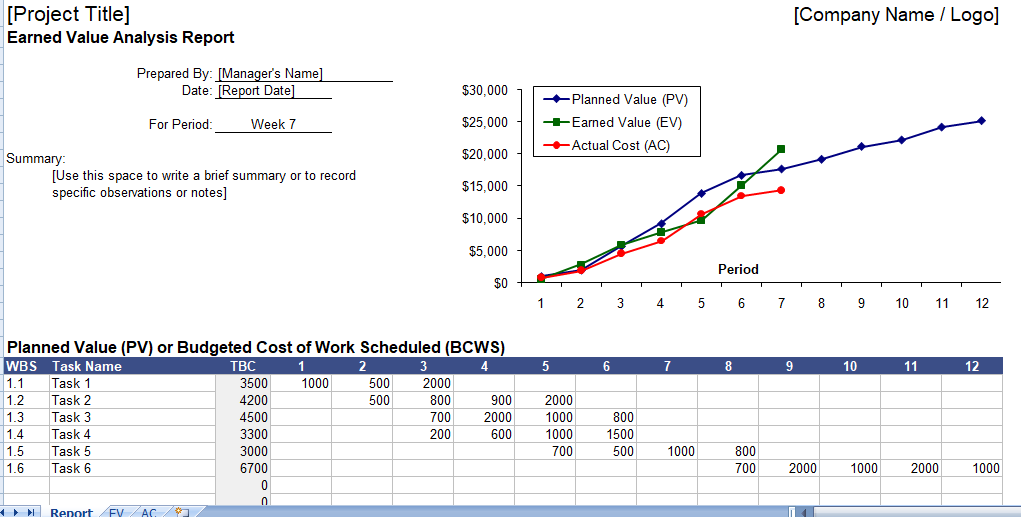
Harnessing the Power of Earned Value Management Project management often feels like a juggling act with countless variables to keep track of. Earned Value Management
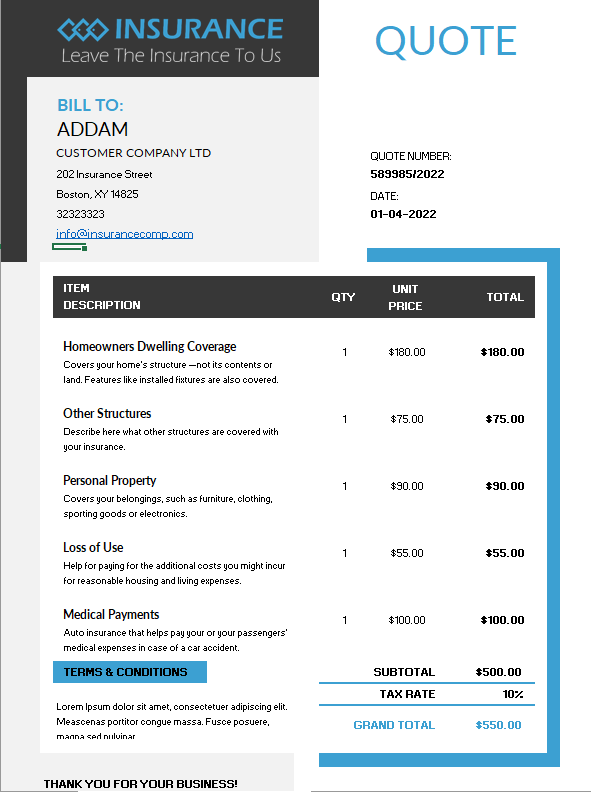
Introduction: Streamlining Insurance Quotations An insurance quote is a vital document in the insurance industry, serving as a preliminary estimate …
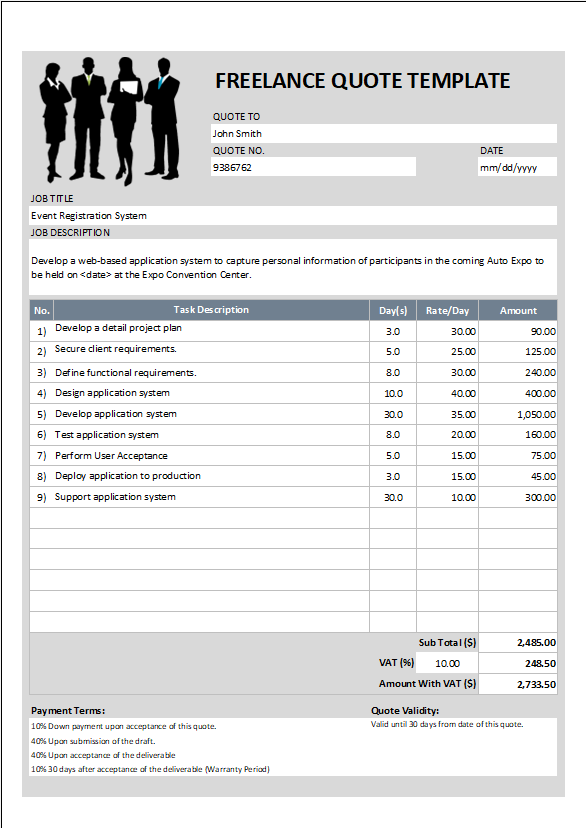
Introduction: Mastering Freelance Quotations In the world of freelancing, creating an effective quotation is crucial for outlining the scope and …
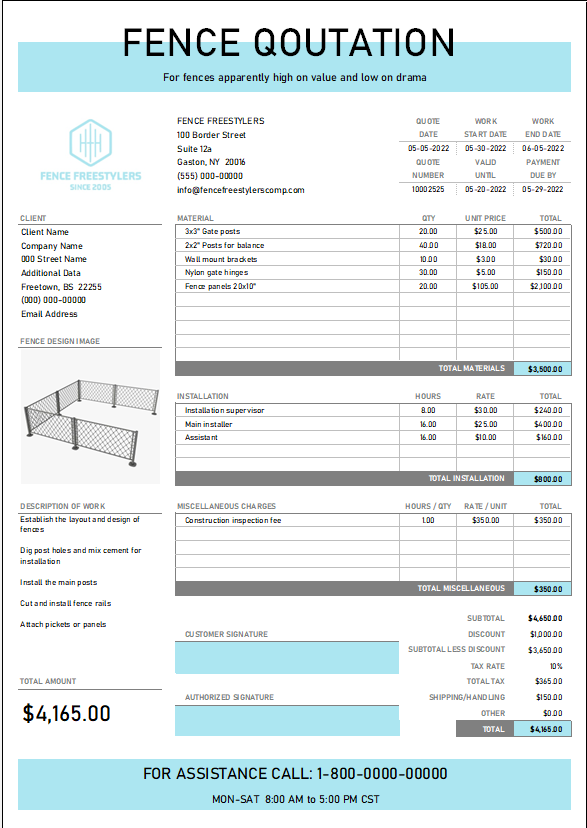
Introduction: Navigating Fencing Service Quotations A fencing service quotation is an essential tool for businesses in the fencing industry. It …
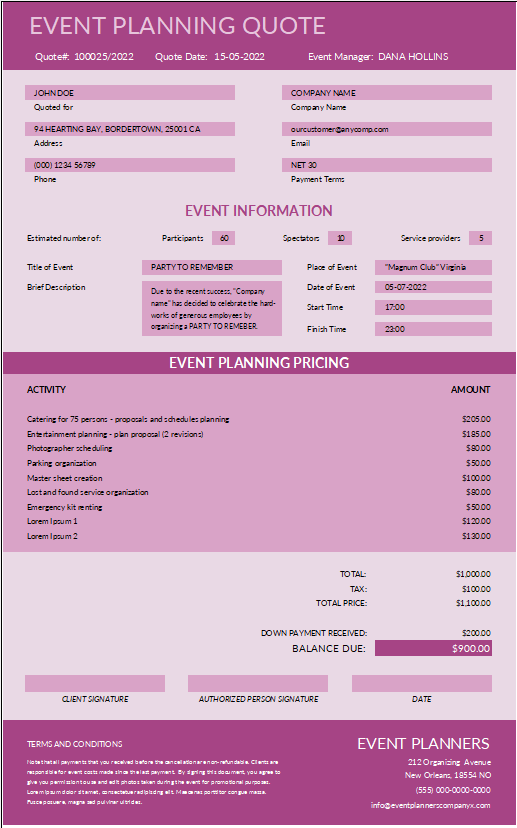
Introduction: Excelling with Event Planning Quotations An event planning quote is a critical document for event planners, detailing proposed services …
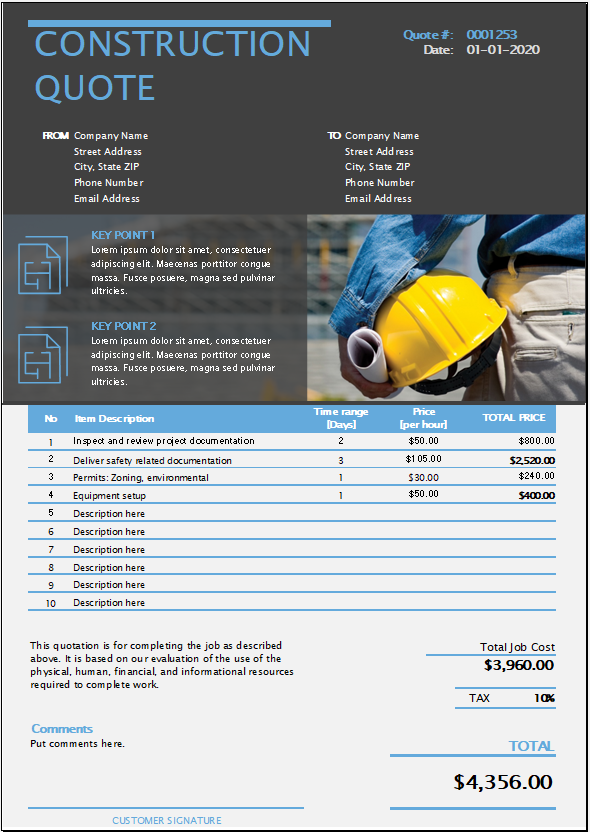
Introduction: Optimizing Construction Quotations A construction quote is a fundamental document in the construction industry, serving as a formal proposal …
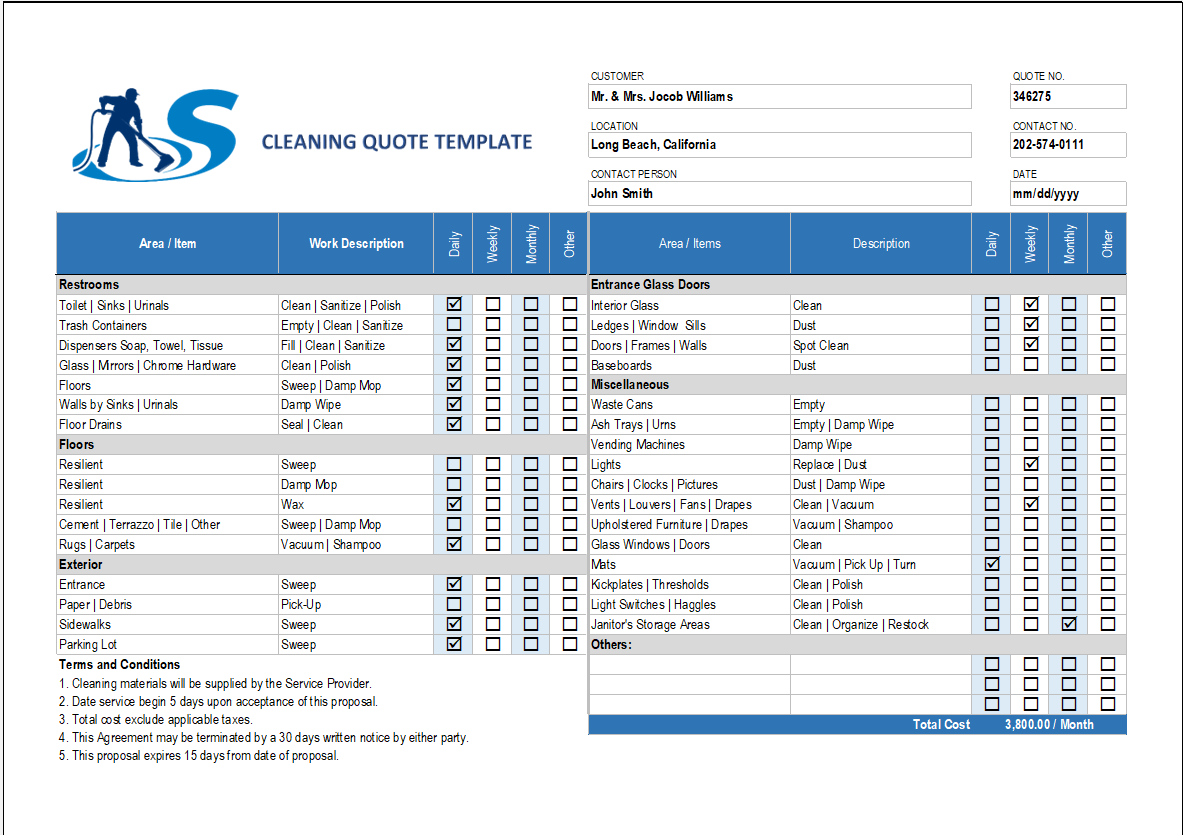
Introduction: Perfecting Cleaning Service Quotations Creating an effective cleaning service quotation is crucial in the cleaning business. It serves as …