Product development Gantt Chart is the process most people don’t think about. But as product development project manager, you know that from large electronics like televisions to small utensils like ink pens, products go through a lengthy development lifecycle.
Gantt Chart Example for New Product Development
Gantt Chart for Product Development
Using a Gantt Chart for New Product Development
The planning and management of a product development project is big job. From the idea-generation phase to the commercialization and product launch, managing a large project such as it takes patience, organization, and all of the skills you possess as a project manager.
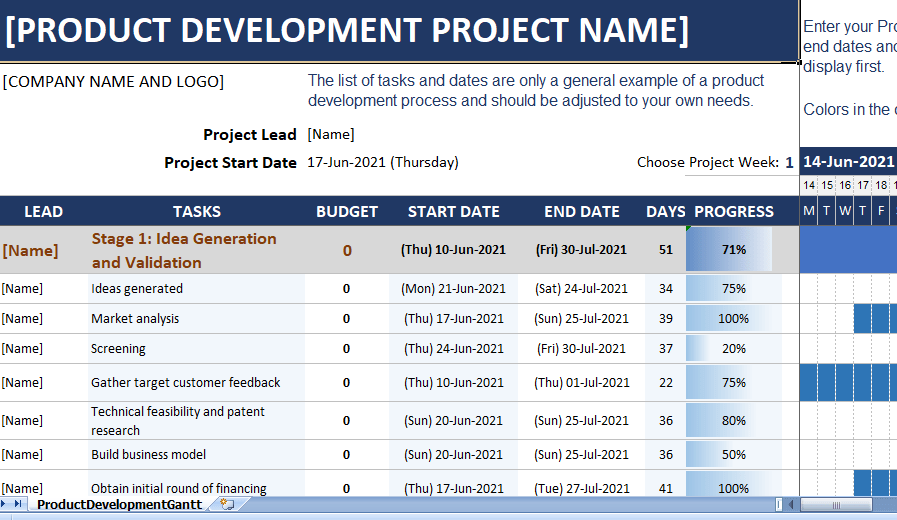
Gantt charts give multiple views of your project. Leads, tasks, budget data, dates, and progress are all arranged nicely for clear view on one side. On the other side, the chart shows a clean timeline of the project throughout its lifecycle.
Benefits of Gantt Charts for Product Development
One benefit of using Chart for product development is that you can enter your work breakdown structure using product development phases, and still get clear picture of your schedule, dependencies, and project timeline.
Another advantage is that a project manager, you’re likely already familiar with the mechanics of Gantt charts. If you haven’t used them before, you’ve almost certainly used similar tools for other projects. So, there’s no learning curve to worry about.
One final advantage to mention in relation to this particular Product Development Gantt Chart template is that it’s available free. The online Gantt chart tools mentioned earlier, along with most others you’ll find, come with a price tag.
System Development Life Cycle Gantt Chart
The key features for this Product Development Gantt Chart are:
- The timeline table: task management table where you can add, delete, organize, and sort tasks.
- The timeline bar chart: chart showing information about the planned and actual schedule, relationships and progress for each task.
- The Gantt bar: bar showing the task duration.
- The dates: start and end dates, as well as task duration.
- Progress: view a project’s status.
The Chart View
The Gantt chart view on the right is where you can see your project timeline. Using calculations based on the start dates, end dates, and progress you enter in the work breakdown section, you get clean picture of your project’s progress.
This clear chart display gives you a simple way to view the project timeline. Task dependencies, schedule, dates, and how your project is progressing overall.

