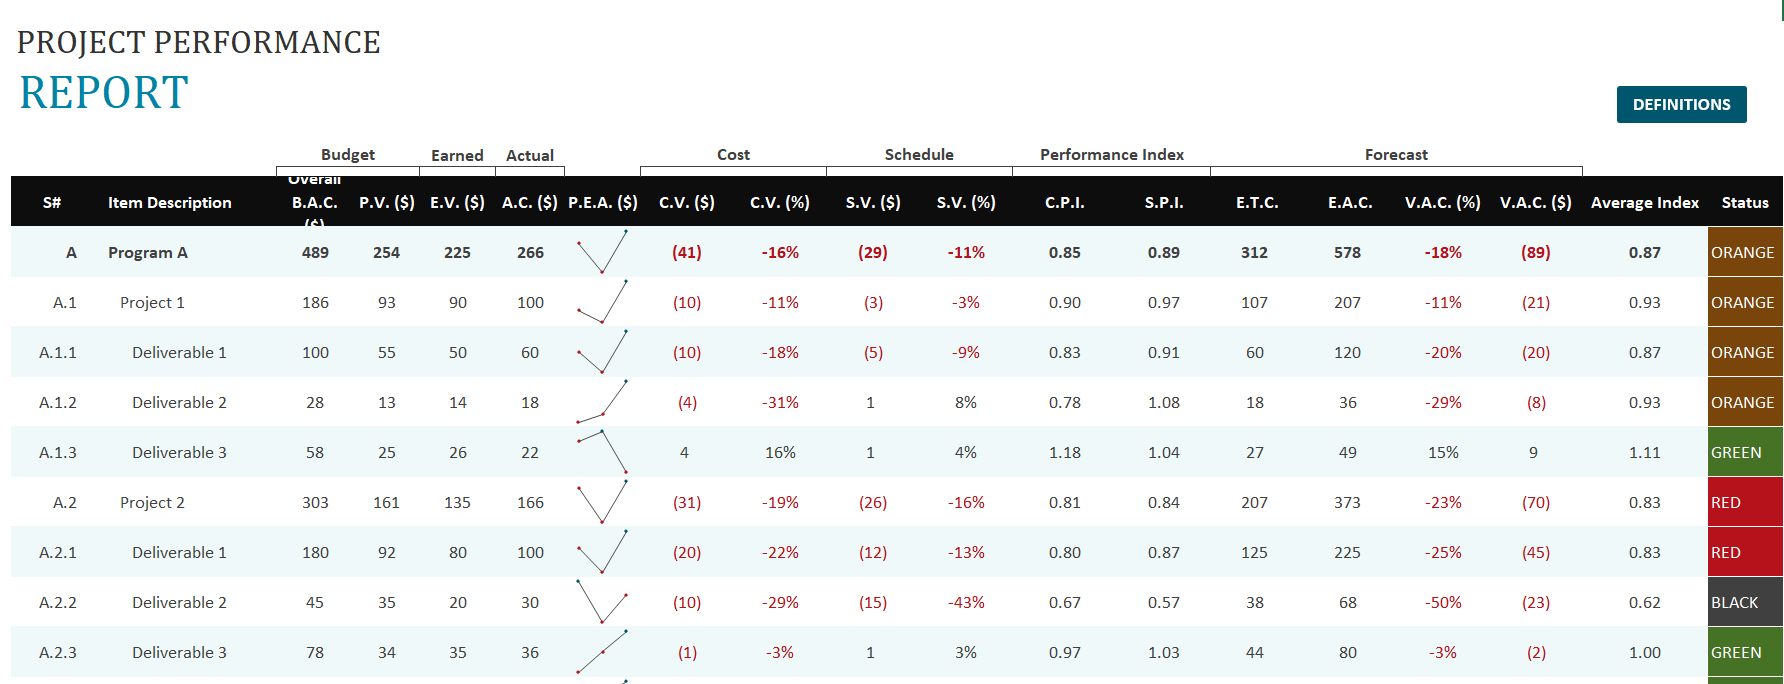
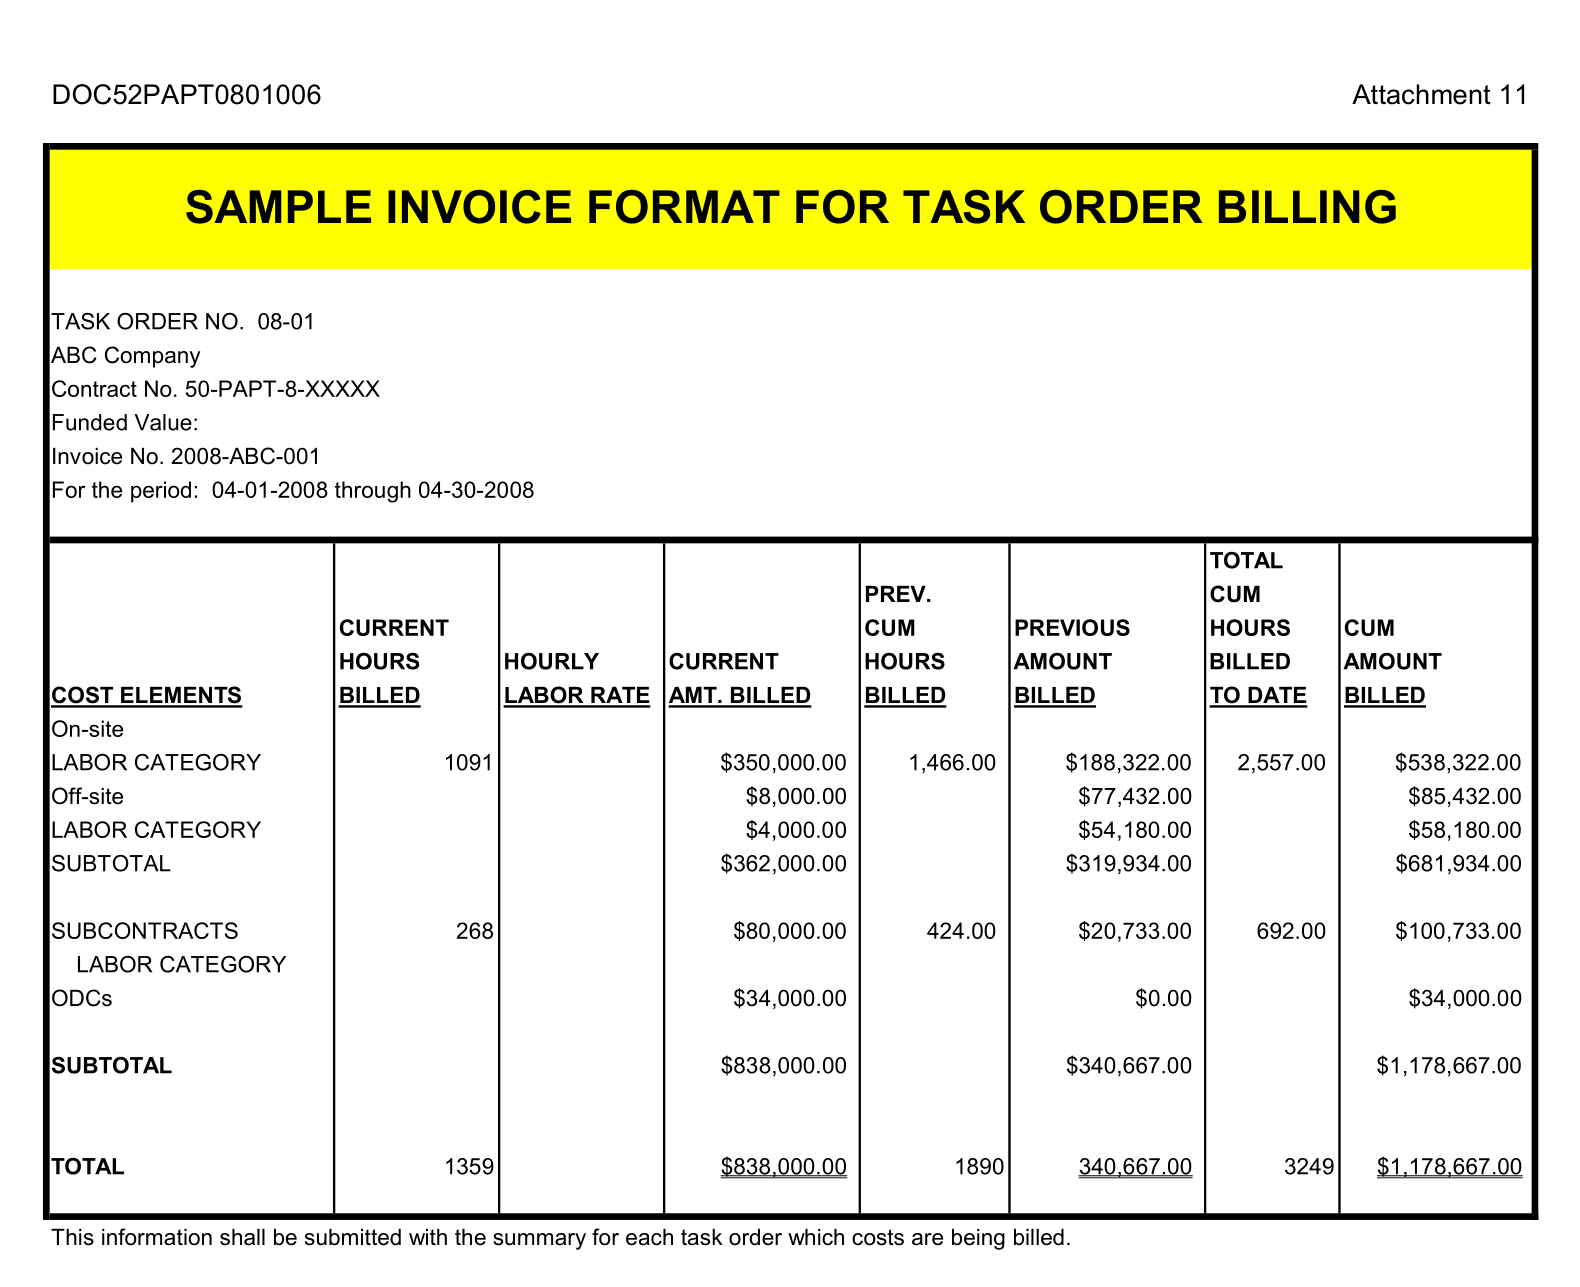
The project management report is an important activity in project communication. It involves collecting and distributing project information, reporting project progress, utilization of resources, and forecasting future progress and status.
During the process of performance recording, the work processes are also analyzed and combined into performance reports.
The management report balances actual outcomes to a budget or standard, in addition, to the variance between the two figures. The receiver of a record is expected to take action when there is an unfavourable variance. If it is not reasonable, then any outcomes derived from it will be invalid.
Project management reports organize and summarize the information collected and present it to the shareholders. They assist in understanding the direction the project is going and how it will perform in the future.
How to Create Project Management Report in Excel
Management report Template collects real-time data to make reporting more accurate. The live panel automatically calculates this data and displays it in easy-to-read graphs and charts that show project metrics.
Management reporting is the process of documenting and defining the projects, products or services that a company makes. The report covers scope, costs, quality assurance, and schedule.
This worksheet covers all the primary elements of the project status report in a one-page format. The pre-built status report provides an overview of project status by category (i.e., actual cost, earned value, and cost variance), project timeline, issues, more about issue ownership to ensure that you complete all project action items on the schedule.
You need to collect all sorts of data to keep track of your progress like (Expected Cost Needed or Expected Total Cost). After that, you need to properly analyze that data. In fact, statistics show that this is the main part of project management.
Select any columns in your data that you want to create a report table for metrics
You can use the presented dialogue box and the columns already selected. Choose OK.
Choose the appropriate domain names to generate the required data.
Select the option “Description” or “Formulas/Values” and the Calculation menu for Professional Project Management.
Add the necessary formulas to the column (in this case, it will be profit/sales*100).
The purpose of conducting the valuation and then preparing the register is an important part of this documentation. So, this is a Handy and Easy Template to use.
Importance of Management Report
The project Management reports show shareholders how the project is going.
Help to analyze additional funds, resources, or schedule extensions for baselines.
Reporting provides a view into the presentation of a business and lets you track your activities and objectives.
A management report can also be used to benchmark your performance in contrast to competitors. It lets you know where you’re falling short and could grow your competitive edge. also, monitor your workforce.
Management reporting helps you to build annual reports and stay compliant if your business is regulated. But most companies use it to improve their business performance as well as create clear communication.
Information about Management Report
Management Performance Information is used to create project activity metrics to valuate actual progress compared to planned progress. These metrics include – Planned versus actual schedule performance
Costs Variance versus Cost Performance
Earned Value versus Planed cost performance
Planned versus actual technical performance. A percentage of the work completed during the recording period
The balance of the work
Costs incurred during the registring period
The balance of money available
The balance of time
Significant risks
Identifies risks
Variance analysis (schedule variance and cost variance)
Costs Performance indexes (schedule performance index and cost performance index)
The forecasted funds

