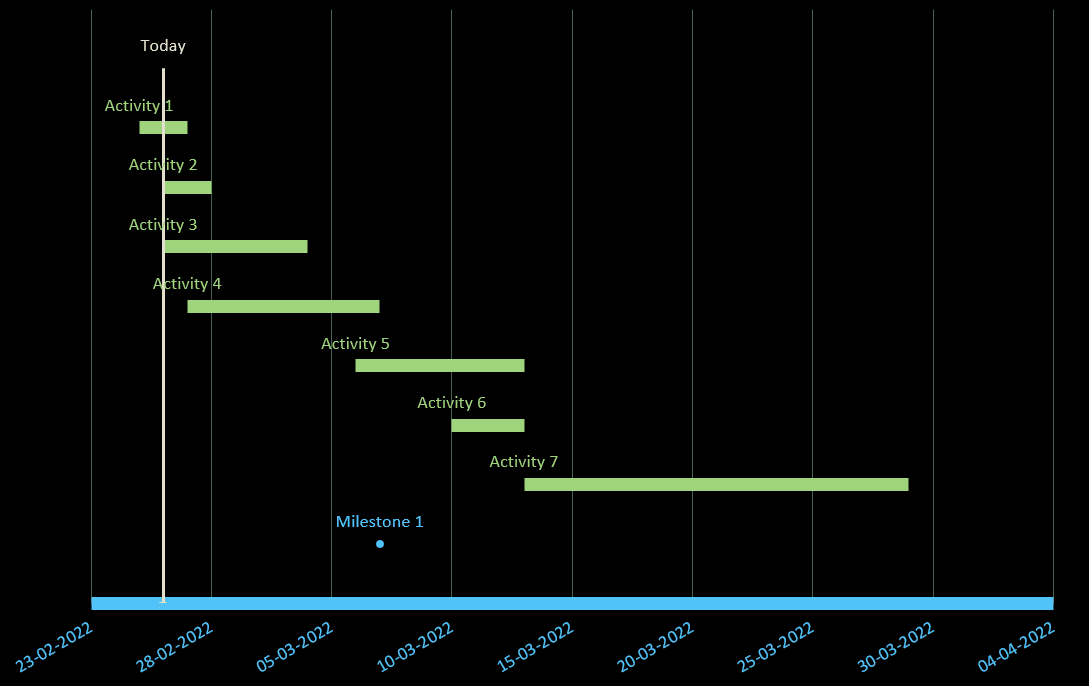
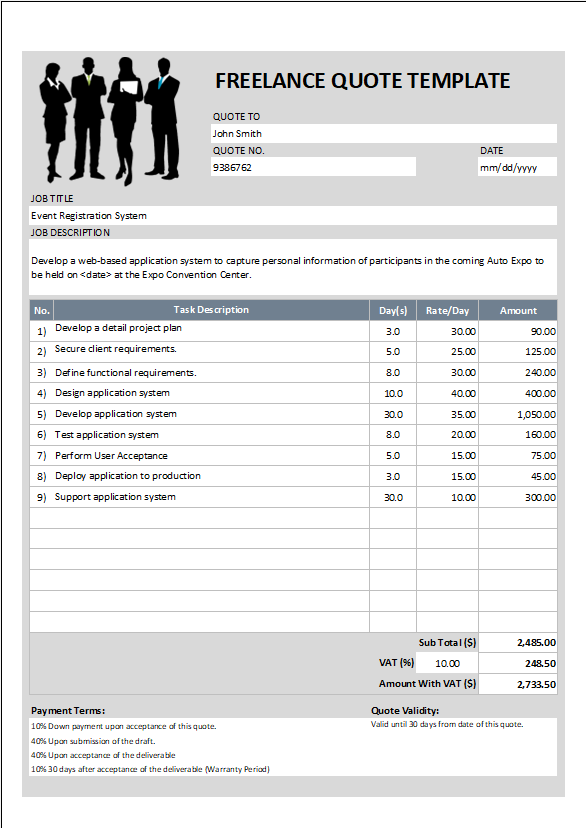
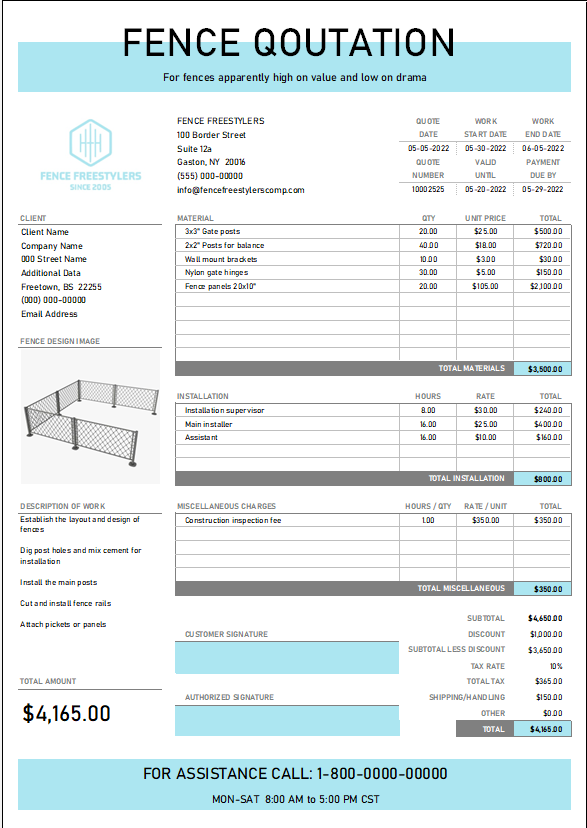
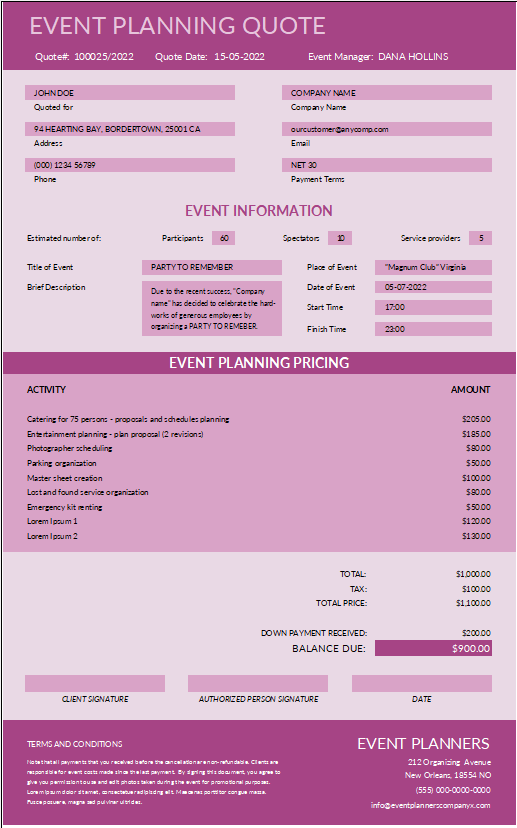
A Tracking Gantt chart is a project management tool that helps in planning, scheduling and monitoring an assignment. Using a tracking Gantt chart helps with multiple tasks, including planning and scheduling, remote work collaboration, resource allocation and the balanced of tasks according to dates. For instance, Project managers and team members can view the task schedules, dependencies and progress by just glancing at the date chart. And it is most widely used in Project Management and Planning assignments. It helps managers and working teams to visually plan and track projects. It also makes it easy for project managers to identify the critical path to project completion and ensure that there is no delay in those tasks. This is simple, free and easy to create and use, and display a considerable amount of information at a glance.
How to Create a Tracking Gantt Chart in EXCEL
Visualize and Track your Assignments over a timeline with this accessible tracking Gantt chart worksheet. This date chart template auto-updates when you enter your data. Above all, this tracking Gantt chart worksheet is to stay on track with milestones, dependencies and due dates. Also, you can customize the look of the Gantt chart tracker by changing formats or other elements.
Wanna track today’s Date. Simply use this free Gantt Chart of every tiny Detail of assignments.
A Gantt chart has three key parts: activities or tasks that are to be done, milestones or progress stages and progress bars.
First, include the Chart Data in COLUMNS
These Columns should be Orderd Sequentially
Enter Milestone Description in Chart Data
A Gantt chart has three key parts: activities or tasks that are to be done, milestones or progress and progress bars.
- Plan Start and Position
- Milestone
- Actual Start
- Plan Duration
Add Position, Columns, Chart Milestone within the Task Chart
Enter the date of the milestone in the next column
Milestone Description
Enter and determine the entire description because it will appear on the chart.
Tasks for Chart Data
Enter Start Date for each task. And for the best results sort this column in ascending order.
End Date
Enter the End Date for each Task or Activity.
Description of Task and Activities
Describe the task and dependencies of each milestone.
And at last, a Tracking Gantt Chart is Prepared based on the chart data you enter.
Importance of Tracking Chart
Determine the initial assignment schedule – who is going to do what, when and how long will it take.
Allocate Funds and Resources – ensure everyone knows who is responsible for what.
Supervise and report progress – helps you stay on date and schedule.
Control and Convey the schedule – clear visuals for shareholders and members.
Display milestones – shows key proceeding.
Identify and report problems – As everything is depicted visually you can immediately see what should have been achieved by a certain date and, if the project is on a slow schedule, you can take action to bring it back on the path.
Projects planners also use Gantt charts to maintain their assignments. In addition, they represent other things, the relationship between the start and end dates of tasks, milestones, and dependent tasks. Modern Gantt chart programs are Free Advanced Roadmaps synthesize information and illustrate the deadlines.

