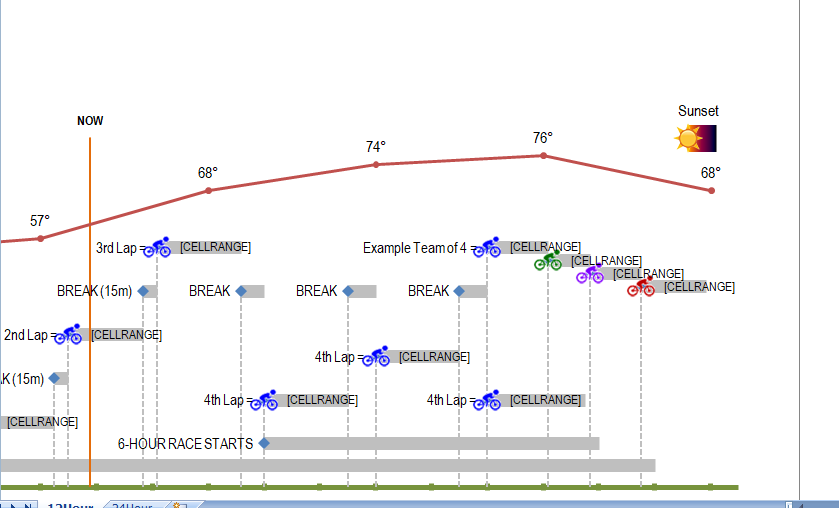
This Bike race timeline came within me because I love mountain biking, and I created it to figure out how to achieve some personal goals in the bike races. For mountain biking, 12-Hour and 24-Hour races are typically involve camping at an awesome location. Riding 10-15 mile loops as many times as you can. Some riders enter solo events and log a crazy number of miles, and others enter team events involving a hand-off after each lap.
Marathon bikes
This template includes two example timelines for helping to plan your laps in an usual bike race. One worksheet is for a 12-hour race and the second worksheet is for a 24-hour race. It works for both solo and teammates (up to 4 bikers on a team).
Bike race timeline spreadsheet
This template is not very easy to use, but there are some instructions within it, and if you stick to it just editing the cells with the white background and gray borders, you’ll mostly be able to figure it out. It only works in latest versions of Excel because it uses many chart tricks.
The hardest part may be figuring out how to change the Minimum/Maximum range for the timeline. First, right-click on the axis and select Format Axis. In the Minimum and Maximum fields, even though it shows a number, you can enter a datetime value like “5/12/2021 8:00 AM” and Excel will convert that to the numeric value.
The point of this template is to help you or your team come up with a reasonable plan for the bike ride. Then print it out creating a set of good/better/best scenarios big mountain endure.
Bike Races
When creating your plan you’ll want to estimate how long a lap is likely to take you as well as each individual on your team. If you’re doing a solo race it’s unlikely you’ll have the time or energy to play with this template on your computer during the actual event. However, if you’re on a team and have a tablet or laptop on hand. You could actually use this during the race to update your times and plan as you plan.

