Download Box Plot Template In Excel

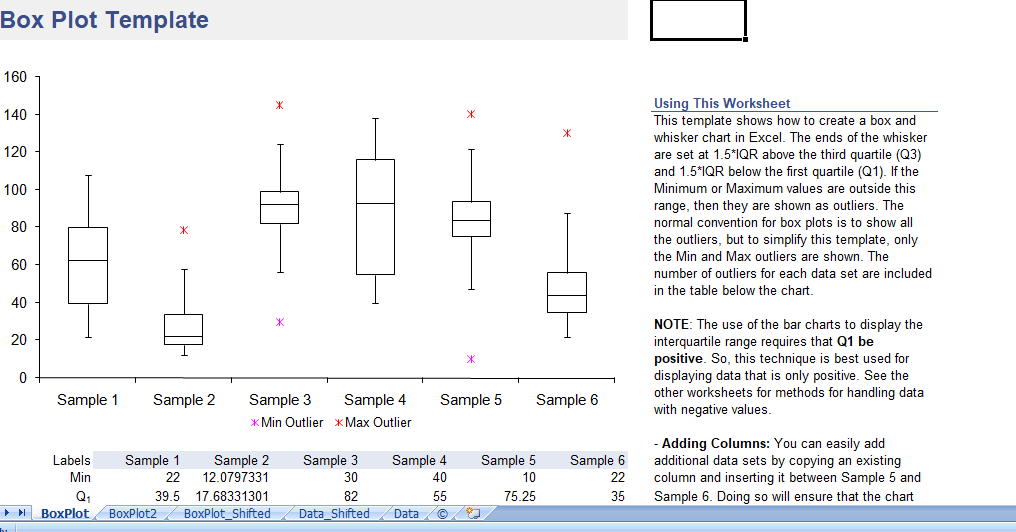
box plot template or box and whisker plot is made in Excel using the new built-in Box and Whisker chart for Excel 2016 or later. To create your own chart, you’ll need to use a couple of tricks. First, the box using stacked column charts. Second, the whisker using y-error bars. Excel provides built-in functions you need to calculate the quartiles used for the “box” part of the box and whisker plot.

Box and whisker plot calculator

Create a box plot quickly and easily. Enter your data into the Data sheet and the chart in the Plot worksheet will update automatically.

Limitation: This template shows only the maximum or minimum outliers, if there are any. Normal convention for box plots is to show all outliers. Certainly, To show all outliers, you can use the new Box and Whisker Chart that is a new built-in chart type in Excel 2016 or later (see the template below).

Regarding Negative Values: Using bar charts to display the interquartile range limits the technique described below to displaying positive values. There are a couple ways around this problem and both of these alternate methods including additional worksheets in the file.

(1) You can shift the data so that it is positive before creating the box plot and

(2) you can avoid the use of bar charts and display Q1, Q3, and the Median using series markers instead.

Creating a Box and Whisker Plot

Mostly, Box plots are very useful data visualization tools for depicting a number of different summary statistics. for graphically comparing multiple data sets. It is much easier to create these plots in Excel if you know how to structure your data.

Creating the Box

The box part of a box and whisker plot represents the central 50% of the data or the Interquartile Range (IQR). The lower edge of the box plot is the first quartile or 25th percentile. The upper edge of the box plot is the third quartile or 75th percentile.

The location of the median line relative to the first and third quartiles indicates the amount of Skewness or asymmetry. If the distribution is symmetric, the median is exactly in the middle. if the median is closer to Q3, the distribution is negatively skew. If the median is closer to Q1, the distribution is positively skew.

The plot in Excel creates using a stacked column chart with 3 series. Actually, the first series (bottom column) is Q1 and the border and area properties are set to none ,the column is not visible in the chart. The second series is Q2-Q1. The third series is Q3-Q2. These two series, stacked together make up the interquartile range. The area property is set to none for these two series to create just the outline for the box.

Creating the Whisker

Certainly, The whiskers in a plot represent the tails of the distribution. The whiskers can be created using error bars in Excel. Because of the ease of calculation, the convention for the length we use in the box plot template:

  • The upper whisker starts at Q3 and extends upward to Q3+1.5(IQR) or the maximum value, whichever is lower.
  • The lower whisker starts at Q1 and extends downward to Q1-1.5(IQR) or the minimum value, whichever is greater.

However, Another common convention is that instead of extending the whisker to a calculated value of Q3+1.5(IQR). The whisker extend to the last data point that is less than or equal to Q3+1.5(IQR), and similarly with the lower whisker.

In the box plot template, the whiskers is create  adding Y-error bars to series 1 (Q1) and series 3 (Q3-Q2).

Download this Box Plot template in Excel Format

Our easy to use editable Excel templates and save your significant amount of time and effort. Here’s how to download and use one of our templates:

  1. Download this free Excel Template: Once you’ve browsed through our collection of templates and find the one that best fits your needs. Once you’ve found the template you want, click on the download button.

  2. Replace sample data with your actual data: Once the template is downloaded, open it in Excel. You’ll see that it is already set up with sample data. To start analyzing your own data, simply replace the sample data with your actual data.

  3. Customize the template: Our templates are completely editable, which means you can customize them to fit your specific needs. For example, you can change the formatting, add or remove columns, or create new charts and graphs.

  4. Use the Excel template: Once you’ve fed in your data and customized the template, you’re ready to start using it for data analysis. Use the various tools and features of Excel to analyze and visualize your data, and make informed business decisions.

  5. Save and share: Once you’ve finished working on the template, save it to your computer and share it with other members of your team or stakeholders as needed.

Click Download Button To Get Box Plot Excel Template

Instruction :

All Excel templates and tools are sole property of xlsxtemplates.com. User can only download and use the excel templates for their Personal use only. All templates provided by XLSX templates are free and no payment is asked. However, you are not allowed to distribute or share in any other website for sole purpose of generating revenue from it.

 You can also download and use our 1000 Best PowerPoint Presentation Templates and 500 Resume Samples from PPTXTemplates.com  Completely Free. All our templates are designed by Professionals

Download Free Editable Excel Templates | Popular Templates

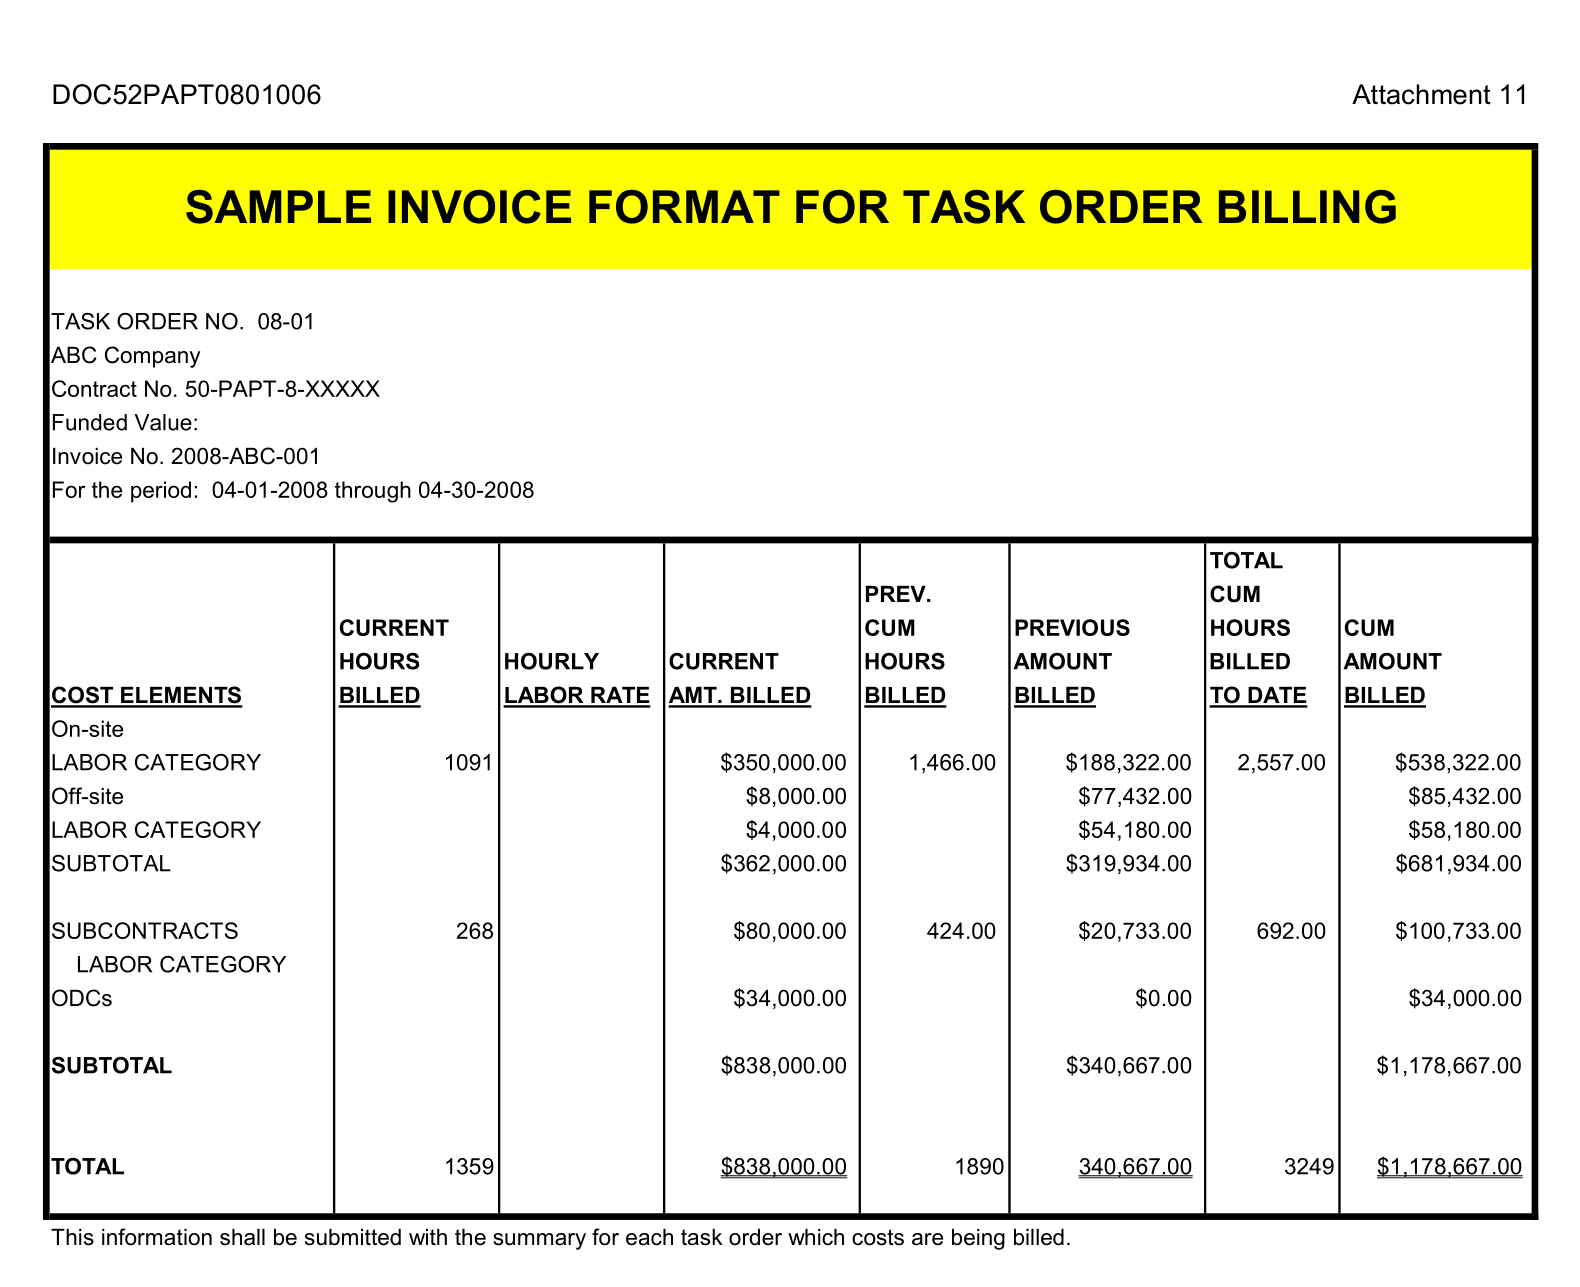
Task Order Billing Format

Task Order Billing Format

Task Order Billing Format Template: Your Key to Efficient Milestone-Based Invoicing In a landscape where project dynamics shift and evolve, billing clients based on project

Read More »
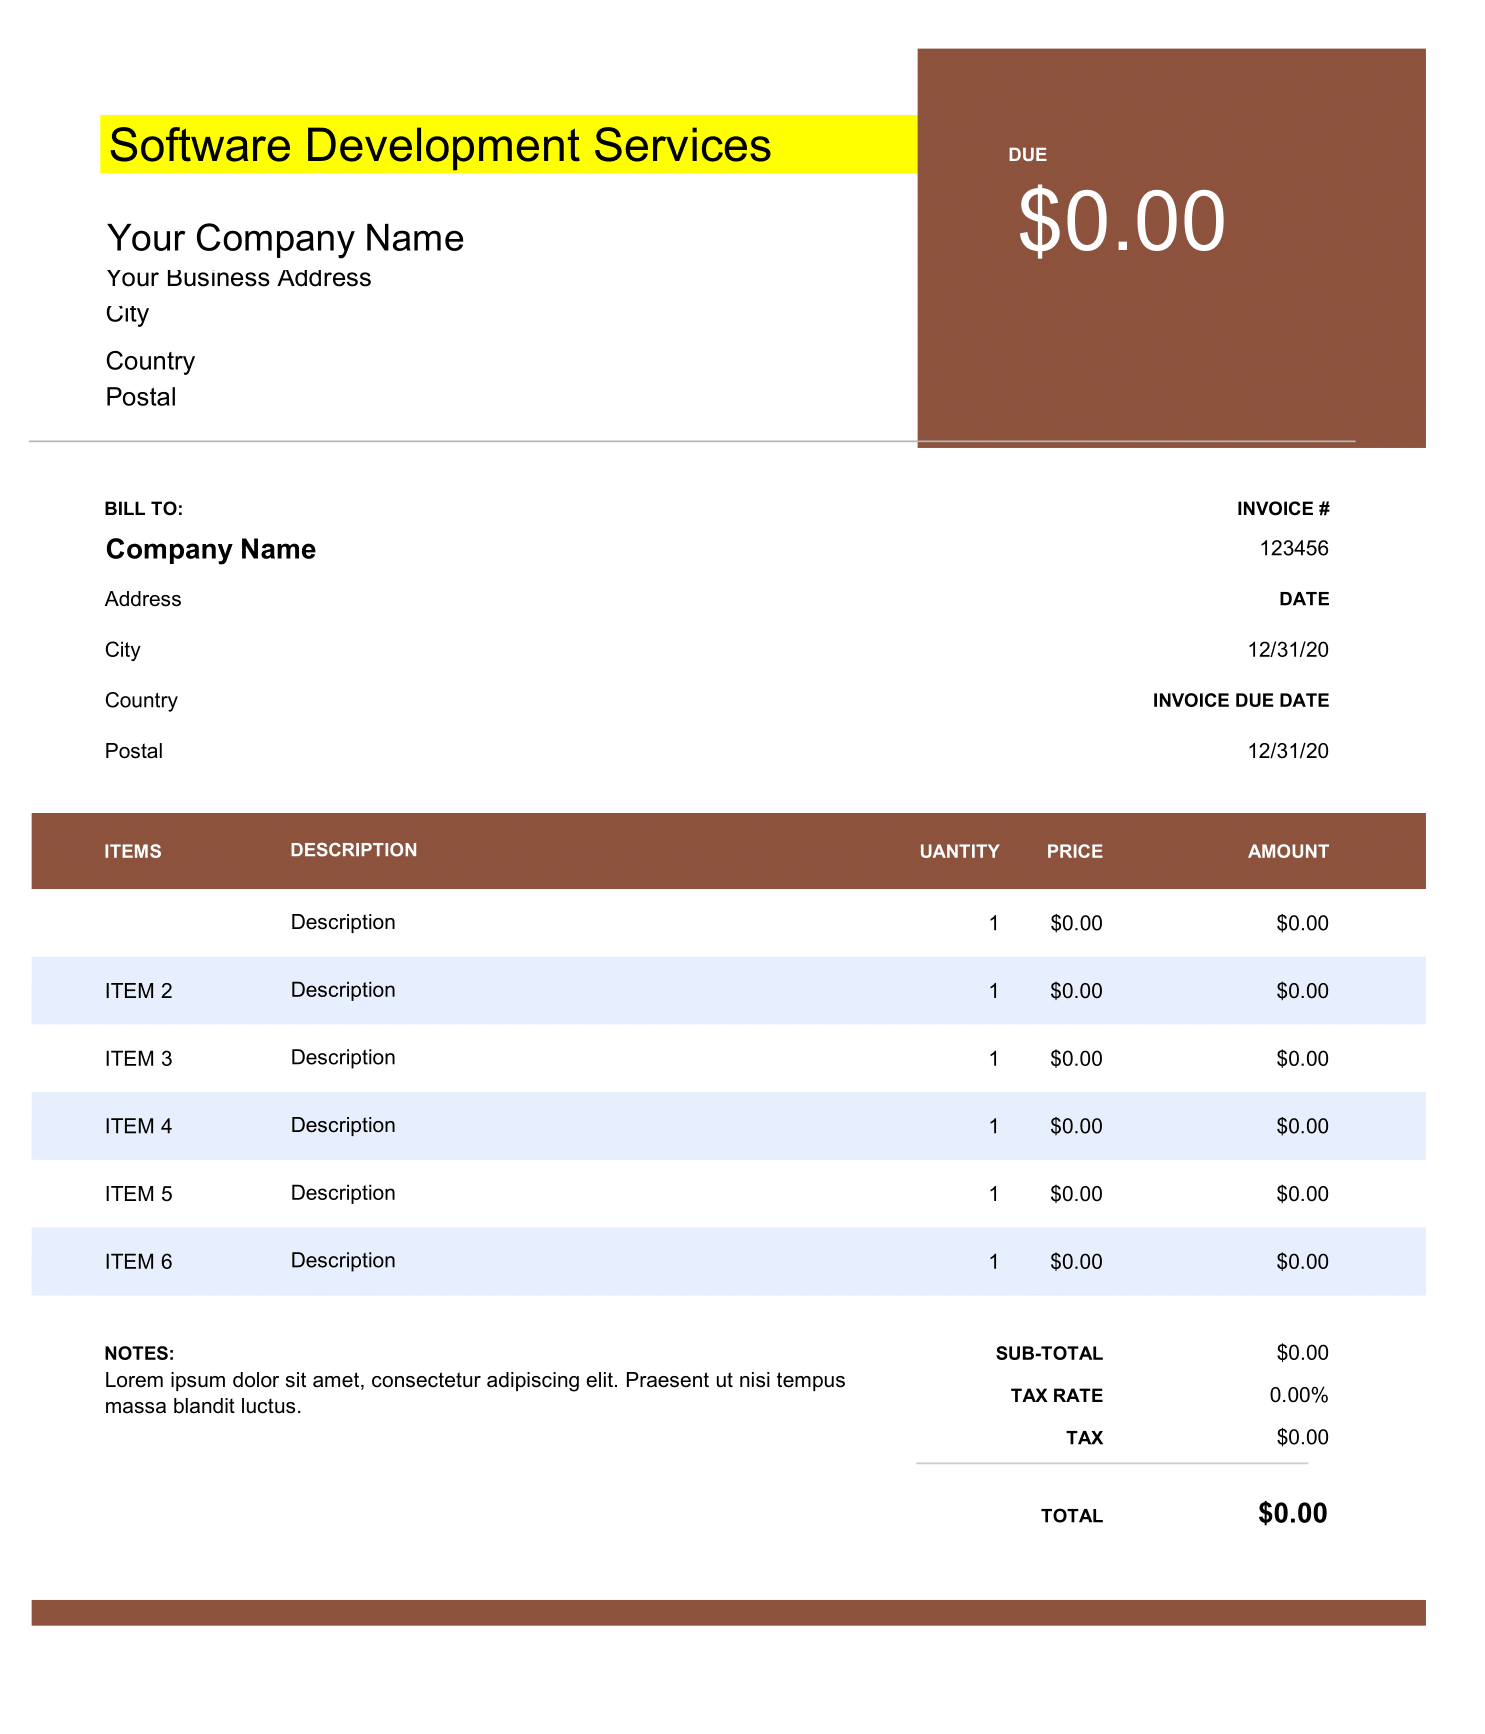
Simple Tax Invoice

Simple Tax Invoice

In the realm of business, clarity, precision, and simplicity can be the key to smooth transactions. A Simple Tax Invoice Template is designed to cater

Read More »

Free editable professional Excel templates can be a useful tool for businesses, organizations, and individuals looking to streamline their data management and reporting processes. These templates can provide a pre-designed and pre-formatted framework for storing and organizing data, as well as for creating charts, graphs, and other visualizations to help communicate that data more effectively.

One advantage of using professional Excel templates is that they are often designed by experienced professionals who understand best practices for data management and visualization. This means that the templates are likely to be well-organized, easy to understand, and aesthetically pleasing, which can make working with them more efficient and enjoyable.

Another advantage is that these templates are often fully editable, allowing users to customize them to meet the specific needs of their organization or project. This can include adding or deleting rows and columns, changing the formatting and layout, and adding custom formulas and functions.

Some examples of professional Excel templates that may be available for free include budgeting templates for personal or business use, project management templates for tracking tasks and deadlines, and sales tracking templates for analyzing and forecasting sales data. There are also a wide variety of templates available for specific industries, such as real estate, marketing, human resource, Payroll management and among others.

Overall, free editable professional Excel templates can be a valuable resource for anyone looking to improve their data management and analysis skills. By providing a pre-designed and customizable framework for storing, organizing, and visualizing data, these templates can help users save time and make more informed decisions.