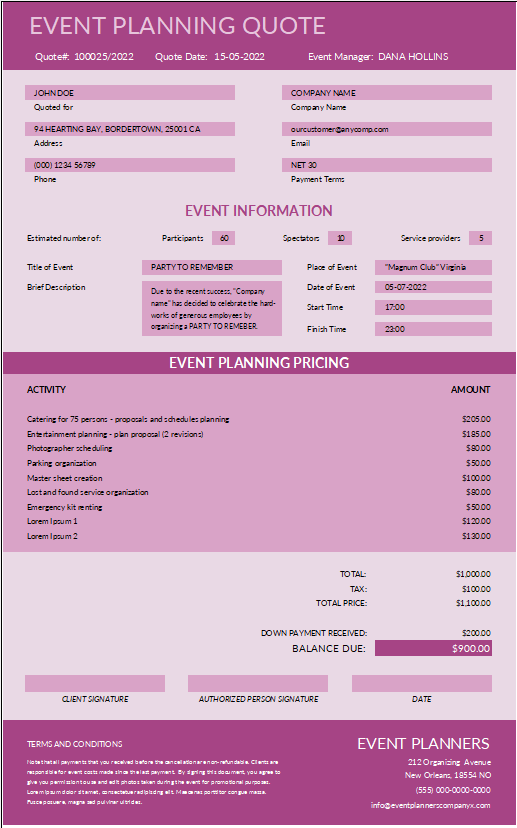
Enhance Your Financial Performance Analysis with Our Free Cash Flow Analysis Template
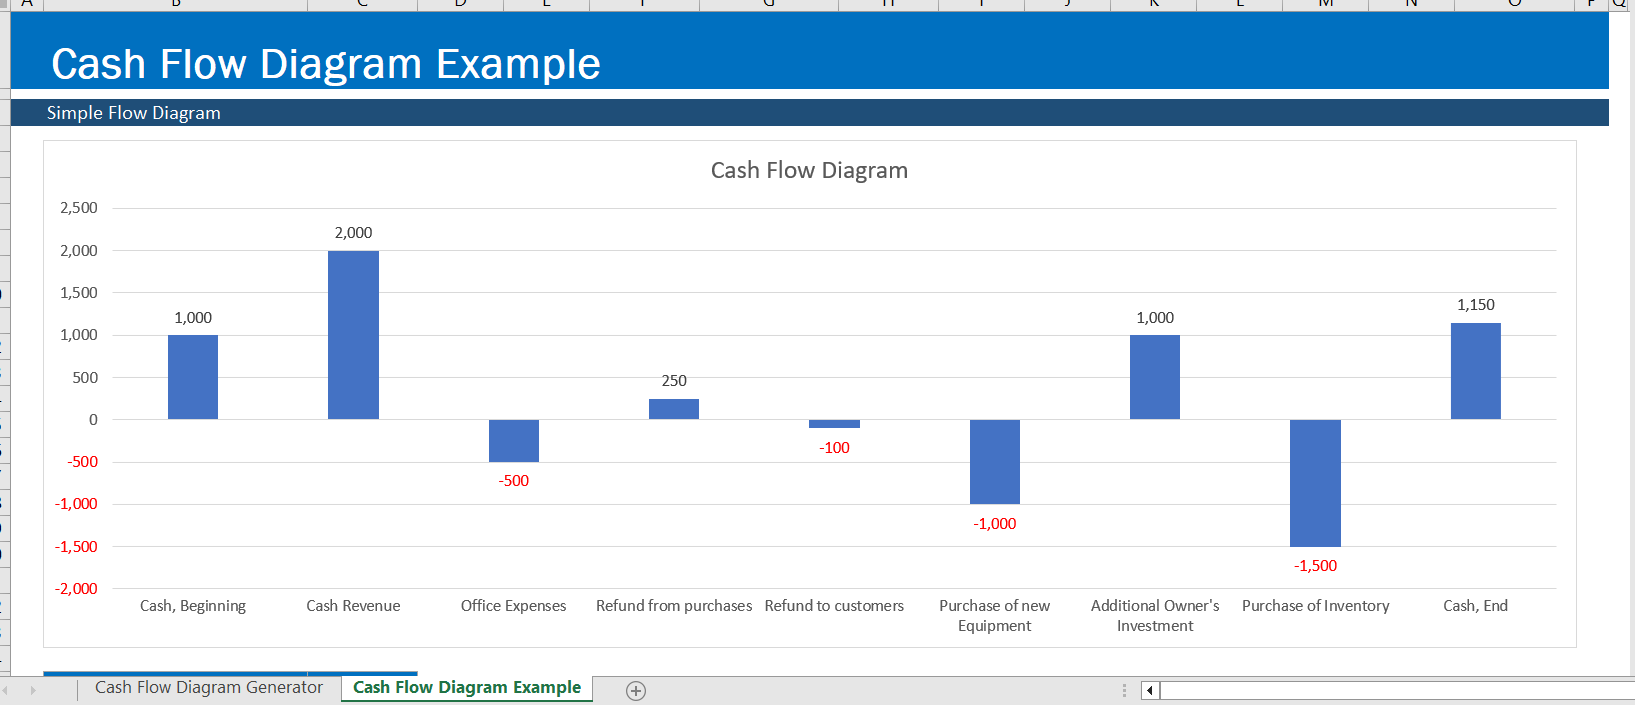
Cash flow analysis is an essential aspect of assessing a company’s financial performance, as it allows you to gain insight into the company’s liquidity and solvency. A well-designed cash flow analysis template can simplify this task and provide valuable insights to help you make informed decisions. That’s why we’re excited to introduce our Cash Flow Analysis Template, a user-friendly and efficient tool that visualizes your cash flow with a bar diagram. Best of all, this template is available for free download!
How the Cash Flow Analysis Template Works:
Our Cash Flow Analysis Template is designed to be easy-to-use, even for those who are new to financial analysis. All you need to do is input your data, and the template will automatically generate a bar diagram to visualize your cash flow. The template breaks down cash flow into three primary categories: operating activities, investing activities, and financing activities. This clear representation helps you quickly identify trends and analyze your company’s financial performance.
Benefits of Using the Cash Flow Analysis Template:
- Easy to use: Our Cash Flow Analysis Template is designed with simplicity in mind. With minimal effort, you can input your data and gain valuable insights into your cash flow.
- Visual representation: The template’s bar diagram helps you quickly spot trends and identify areas of strength or weakness in your cash flow. This visual aid makes it easier to interpret the data and make data-driven decisions.
- Comprehensive analysis: By breaking down cash flow into operating, investing, and financing activities, the template provides a comprehensive view of your company’s financial performance. This detailed analysis can help you better understand your company’s financial health and identify opportunities for improvement.
- Free to download: Our Cash Flow Analysis Template is available for free download, making it accessible to businesses of all sizes. This valuable tool can enhance your financial analysis without adding extra costs to your budget.
Understanding your company’s cash flow is crucial for making informed decisions and ensuring long-term financial success. Our Cash Flow Analysis Template is a powerful and user-friendly tool that simplifies this process by providing a clear visual representation of your cash flow data. Download the template for free today and unlock valuable insights into your company’s financial performance.