European Soccer League Fixtures and Scoresheets
These are the latest spreadsheets for European Soccer League season 2019/2020 in 4 countries. Those are La Liga Santander (Spain), Serie A (Italy), Bundesliga (Germany), Ligue 1 (France).
As usual, these spreadsheets are created specifically for those respective leagues only. And it is the 7th time that all spreadsheets are using Soccer League Creator template to emulate those leagues. To use it is simple. All you have to do is just typing the scores and see the standings adjusted automatically based on certain rules applied in each country.
European Football League Fixtures and Stats Tracker
I started to create fixtures and scoresheet for Spanish La Liga, Italian Serie A, Germany Bundesliga and French Ligue 1 in 2008. Each year, I added few more features and started to create a dynamic template that can accommodate all of those leagues within one spreadsheet just by changing some parameters.
I revisited this original spreadsheet and I saw that this simple spreadsheet can be used to develop record team match statistics. But, it won’t record all match stats but should be enough for important stats.
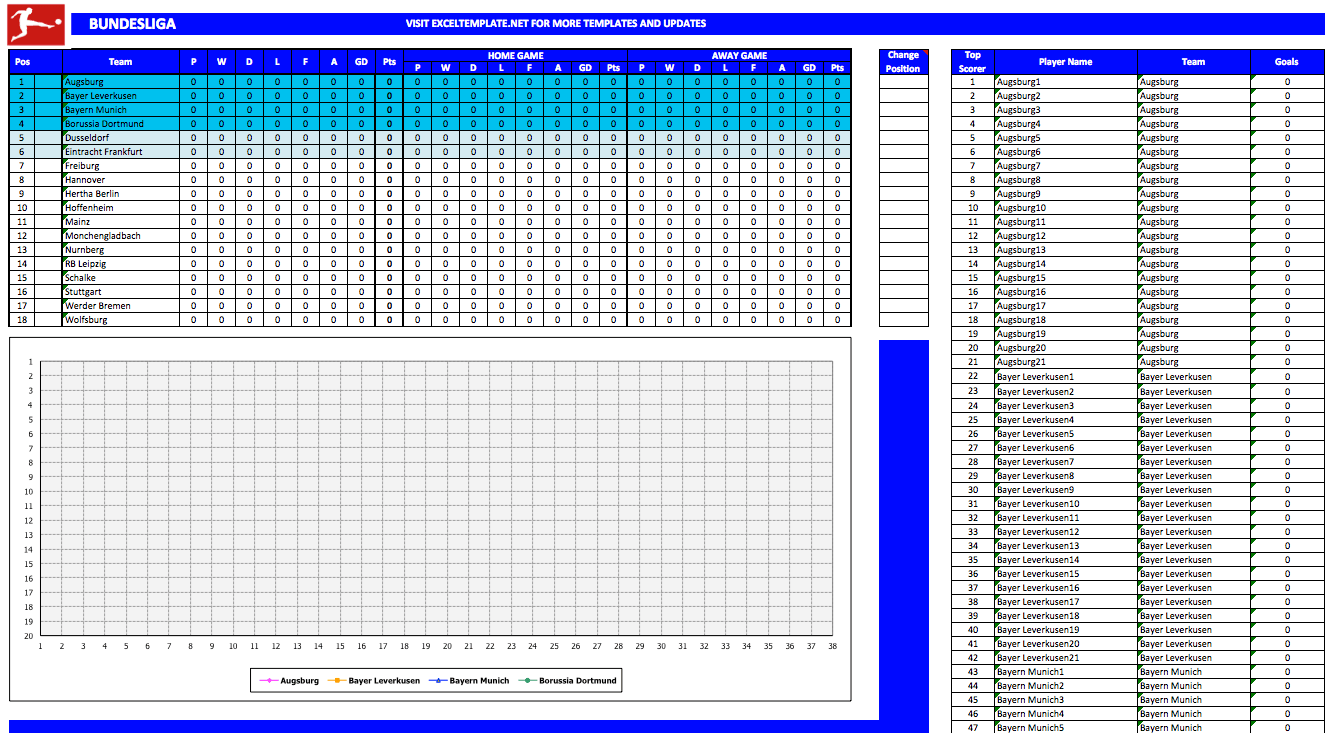
Team Standing and Top Scorer Table
You can track rank progress of all teams after they completed their matches. Here, you can see their performances while they are playing at home or away. They are ranked with tie-breaker regulation as follows :
- Highest Point
- Better Goal Difference
- Better Goals Scored
- Manual Re-Rank
Since it uses a simple tie breaker formula, you need to reranked them if their final positions are not similar with the official standing. You can use Change Position table at the right side of standing table to switch their position.
Team Setup
Type team names and their home stadium in the worksheet. There is a point reduction column to put point penalty if any particular team is punished by their country league official. There is a column for counting number of team occurrences in the Fixtures and Results worksheet. You can use it to check whether you have type team names correctly. It should be same with the number of matches that particular teams play in respective leagues. For example, in La Liga, each team have to play 38 times within one season.
Fixtures and Results
This is a one-page fixtures worksheet. You can copy and paste all fixtures in this worksheet. This is the worksheet where you can update score results weekly.
Team Stats
This is a worksheet where you can update particular team stats. I will explain them as follows. I separate this worksheet into 8 parts to ease explanation as you can see in the image below.
The Excel formula will place team’s name automatically in each worksheet. But, in simple version, since it only accommodates one team, you will have option to select one team to record its match stats.
A. Player Names and Stats
In this table, you can type until 30 player names, including their shirt numbers and positions. It is not based on shirt number order. At the right columns, next to each player name columns, you will see their stats. These numbers will update automatically based on stats you put in the Team Match Stats box (part B).
B. Team Match Stats
Update match results in this match stats boxes. There are 38 matchboxes for La Liga, Serie A and Ligue 1. I used Real Madrid as a sample. This team is always on the left side. You can see them playing home or away by seeing Home/Away note at Home/Away column.
Remember, these match stats boxes are not designed to record all the match statistics. You may need other spreadsheets for that purpose.
C. Match Summary Stats Table
Here, you can see match statistics. There is one table to show you statistic for all 38 matches and one table to show you match statistic in an average.
D. Top Scorer Table
The rank formula will sort all goal scorers by their goals and assist numbers. There are Spanish La Liga, Italian Serie A, Germany Bundesliga and French Ligue 1 spreadsheets you can download to track top goal scorers in those leagues. Like Lionel Messi from Barcelona in Spain, Gonzalo Higuain from Juventus in Italy, Lewandowski from Bayern Munich in Germany and Cavani from Paris SG from France.
E. Goal Distribution Chart
You can see goal distribution over 90 minutes period in this part. They are divided into 15 minutes period.
F. Top Assist Table
You can see your top players in assists.
H. Team Match Chart
This chart will show you the team performance match by match. The top part will visualize win-Draw-Lose result. You can directly see whether their Home and Away matches affected their performance by seeing green and yellow color below it.
I add the visualization of team possession to ease you seeing whether dominating the match will always give the team positive result. At the bottom of chart, you can see their standing progress throughout the entire season.

