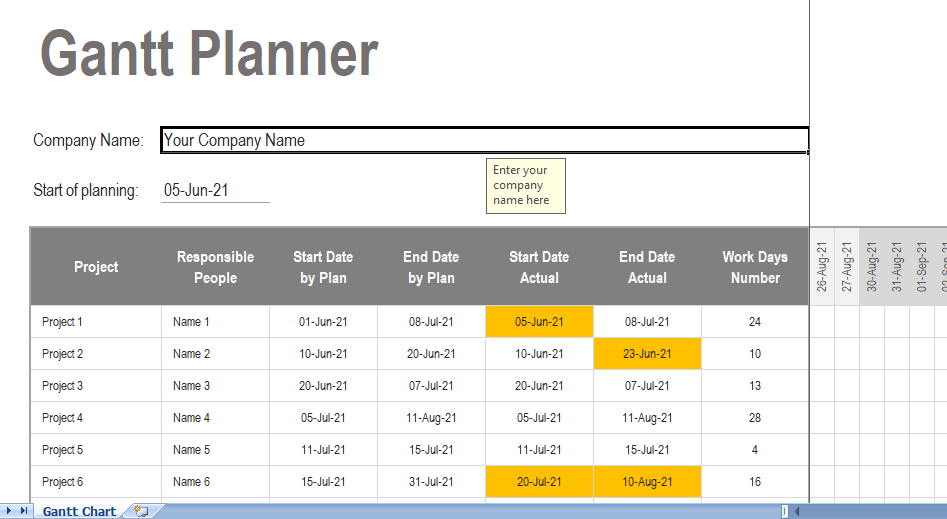
One terrific, undervalued feature of a spreadsheet application like Microsoft Excel in its Gantt Chart with conditional formatting. This allows to format cells automatically based on the data. For instance, you can color a cell change if it matches certain criteria.
Gantt Chart Conditional Formatting
Project Progress and Critical Path for Gantt Chart
With the conditional formatting built into this Gantt chart template,
Creating Your Gantt Chart
This template comes with one workbook tab that has a big area where you can see both work breakdown section on the left and the progress bar chart on the right. These two sections work together to give you rich picture of your project’s timeline as it progresses.
To build a Gantt chart, begin by entering basic project details and then move on to the work breakdown structure section.
Project details
This is where you can paste some basic Gantt chart details about your project.
Work Breakdown Structure
When you finish entering basic project details, you’ll move to work breakdown section. This is where you will enter your project tasks, resources, planned dates, and actual dates.
The Chart View
The Gantt chart view on the right is where you can see the project schedule and critical path. The template uses the planned and actual start and end dates from work breakdown section to give you a clear view of your project’s progress. Just scroll to the right in Gantt chart view to see the bar chart for the upcoming weeks.
The template is designed for 16 weeks. To help you plan your project and understand the chart clearly, each week begins on Monday, contains five workdays, and alternates lighter and darker grey for easier viewing.

