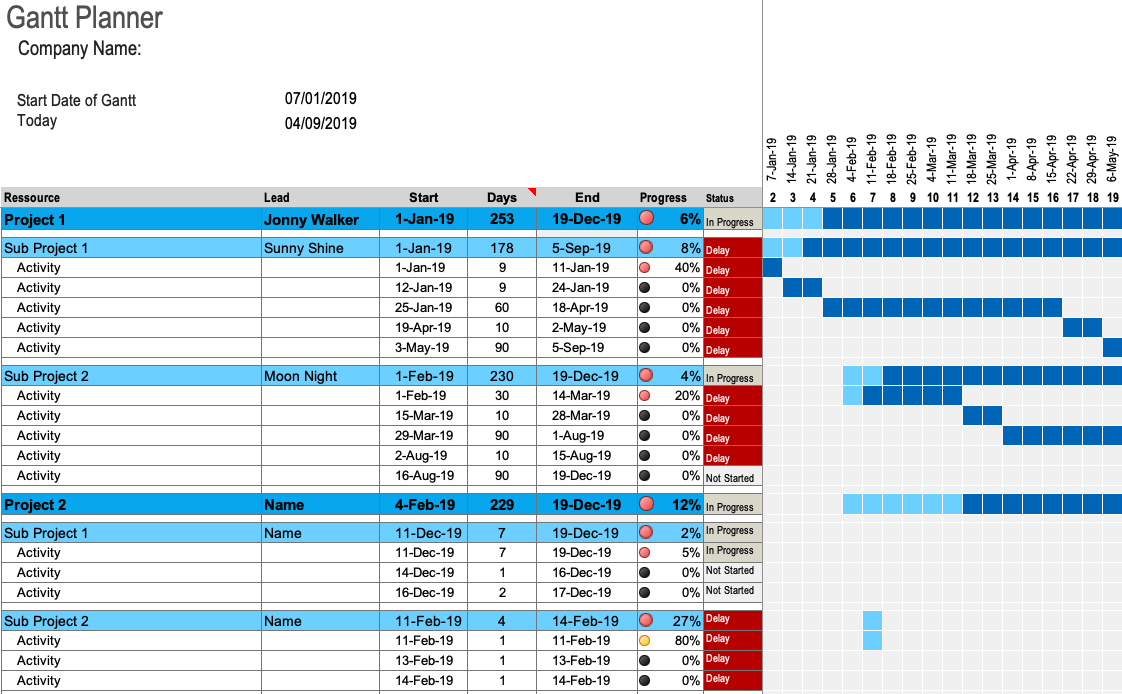
A Gantt schedule planner is a great way to visualize your project’s task list, critical path, dependencies and overall progress. Some Gantt chart software and templates also include spots for resources, let you easily view milestones, assign tasks, and allows you to build specific start and end dates.
Gantt Schedule Planner
A Gantt chart serves as a beneficial task management tool for planning most any type of project.
This is where our Gantt Schedule Planner comes in. With our easy to use templates, you can create a very useful Gantt chart in Excel. You can add task lists from your project plan with starting weeks and durations, and then you can view your project timeline.
By entering both your planned and actual starts and durations into the schedule, you can easily handle the critical path management of your project from start to finish.
Gantt Chart Production Planning Excel Contents
There are two different files in this Gantt Schedule Planner chart template pack for Excel, with a slight difference between them.
By Week with Completions: This file shows percent done indicators, that you can select, in chart view.
By Week without Completions: This file does not show percent done indicators in the chart view.
Gantt Chart for Project Planning excel
You have one large area to see both areas including the work breakdown section on the left and Gantt chart view on the right. These two sections work together to give you a solid view throughout the life of your project.
Project Information
You should start customizing this free Gantt chart template just by entering your project information, as you’ll see below in our example, and then move onto the work breakdown section.
Project Basics
The basics of this simple Gantt planner include the Project Name, Company Name and Logo (optional), and the Project Lead. You’ll see these fields above the work breakdown section in the left, so just click each line to enter these details.
Current Week
The Current Week field is one that you will change through the phases of project. Enter the week number and Gantt view automatically highlights the week column that you enter. This is a fast way to see which activities are taking place in particular week as well as task dependencies and milestones.
Show Gantt For
Beside Show Gantt for label is a drop-down menu where you select either Planned or Actual. This will change chart view for the week Start and Duration numbers in the Planned and Actual columns of the work breakdown section.
It gives you a very quick and easy way to see how well you’ve planned the project timeline, how close you are to your estimates, and the current status of your project.
Show Status (By Week with Completions file only)
If you use the By Week with Completions file, you’ll see that this additional field in the project information section. Next to the Show Status label, click the drop-down box and select the indicator you would like to use in the chart view for percentage done for activities.
Work Breakdown Structure
When you finish completing project details, continue with your plan by adding the information in the work breakdown structure section directly below.
Start and Duration
As mentioned, you have columns for Planned and Actual for your project activities. And each uses Start and Duration (Dur) in terms of weeks only.
Planned
When your project planning starts, you’ll be entering the estimated Start and Duration week numbers into Planned columns for each activity. And, you’ll just enter a simple number.
Actual
The Start and Duration for the Actual column work basically same way. You’ll enter a simple number for which week the task actually starts on (Start) and then the number of weeks that the activity actually takes to complete (Dur).
% Done
As your project progresses and you start receiving updates for your task list from your team, place a number in corresponding % Done field for each activity. You can simply enter a number because the column is pre-formatted for percentage.
This helpful column helps you to view progress and milestones quickly. It also populates the chart view for you automatically if you use the By Week with Completions file.
The Chart View
Your project timeline appears in the Gantt chart view on the right. With the details you enter for the Planned and Actual weeks, you get a crystal-clear picture of your project’s progress from beginning to end.

