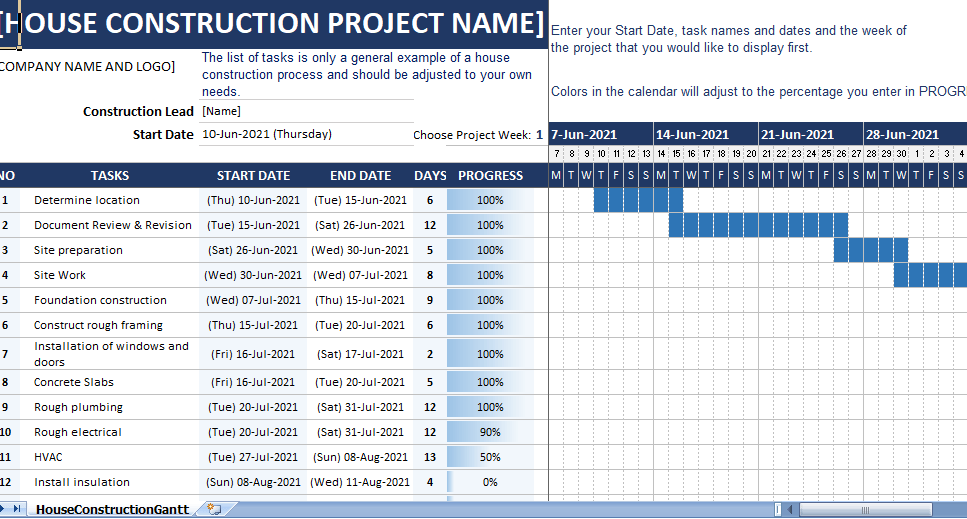
A Gantt chart is a powerful planning tool as it allows you to schedule your activities, and then track those activities from beginning to the end. In early planning stages, you can account for – for example – all the supplies that will need at each stage of the project. And as the project develops, you’ll know what needs to be bought, and when. You’ll be able to track which parts of the project have gone over the budget, and where you might be able to save. And you’ll know which aspects of the project are on time and which might have fallen to some common delay. This House Construction Gantt Chart template gives you everything you need, with built-in formulas and formatting, to ease duty of keeping track of your construction project.
Home Building Gantt Chart
Add tasks and task dependencies, enter start and end dates, and pop in progress for every task. You’ll watch the chart automatically adjust, giving you clearest view of your construction timeline from start to finish.
Create Your Gantt Chart
If you’re familiar with House Construction Gantt chart, then you won’t be surprised to see template has two sections. The work breakdown structure section is on left and the chart view is on the right. These two areas work hand-in-hand throughout life of your project.
Simply follow the steps below to create your own house construction Gantt chart.
Project Information
As you enter project basics and work breakdown structure details, the chart view will populate automatically. So, start by entering your project details.
Project Basics
The basics for this template include the House Construction Project Name, Company Name and Logo, and the Construction Lead (or General Contractor). These fields are above work breakdown section on the left of the template. Click each line to enter these pieces of information.
Start Date
Insert start date for the project in the Start Date field in any format you’re comfortable with. The template will reformat it for you. Once you populate this field, you’ll see Gantt chart view automatically update for months, dates, and days.
Choose Project Week
The Choose Project Week field is one that you will adjust through various phases of the project. You can enter the number 1 here to begin with week one. Then change this number for weeks two, three, and so on, as your project progresses. You’ll see the chart view automatically change to start with that week.
Work Breakdown Structure
Once you finish entering basic project details, you’ll continue your plan by adding the information in the work breakdown structure section directly below them.
The Gantt chart template includes examples for phases of your project to help you get started. You’ll see tasks begin with determining a location and end with the final punch-out. You can use these task samples or replace them as needed for your home construction project.
Project Tasks
To help with planning your project phases, each task is numbered using No column to the left of the activities. If your breakdown structure uses specific reference numbers or letters, you can use those instead.
List each task for project in the Tasks column. While there are no subtasks formatted in template, if you’d like to add a subtask, you can do this easily.
Select the task cell you want to turn into a subtask and click the Increase Indent button on the Home tab of the Excel ribbon.
If you need to add more tasks for your construction scheduling, this is also simple.
- Select a task row by clicking the number on left side of the Excel sheet.
- Right-click the row and select Copy.
- With the row still selected, right-click the row and select Insert Copied Cells. This should place your new row directly above the one you copied.
Start and End Dates
Next, enter the start and end dates for the tasks if you have them from each contractor.
Days Column
Do not enter any data in the Days column. The fields in the Days column will calculate and populate automatically as you enter start and end dates for each task.
Progress Column
Now you can move on to Progress column, where a progress bar allows you to view milestones at a glance and quickly see when a task is 100% complete.
The Chart View
Your construction timeline appears in the Gantt chart view on the right. With the details you enter for the start dates, end dates, and task progress, you get a clear picture of your project’s progress for House construction gantt chart example.

