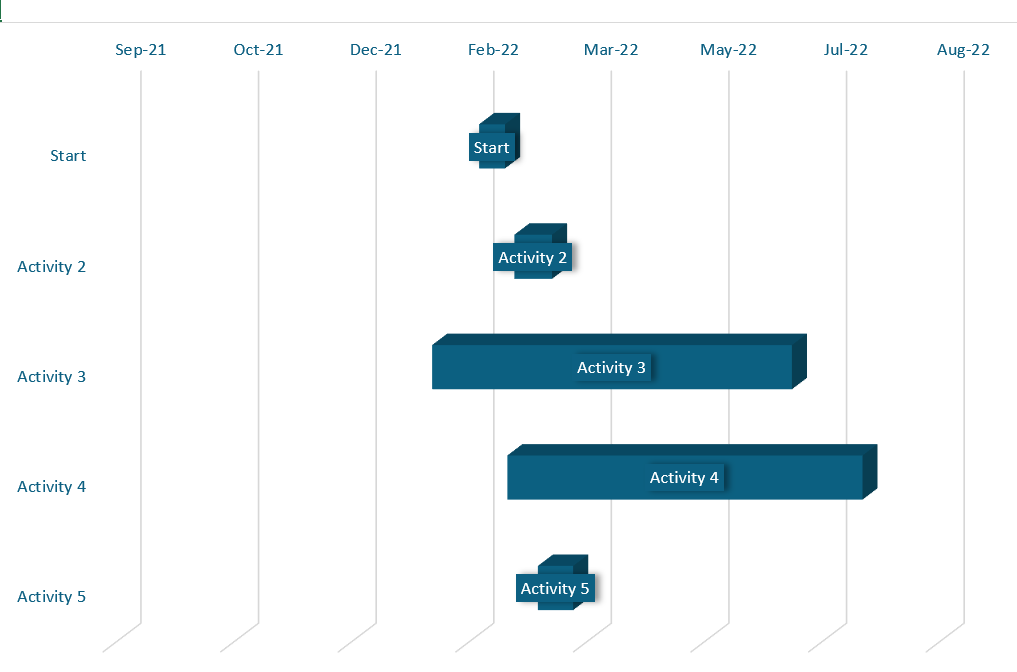
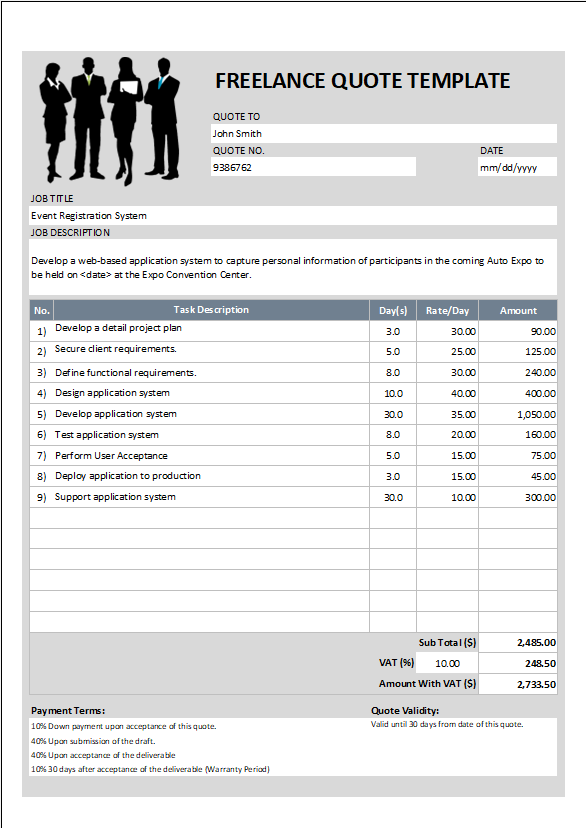
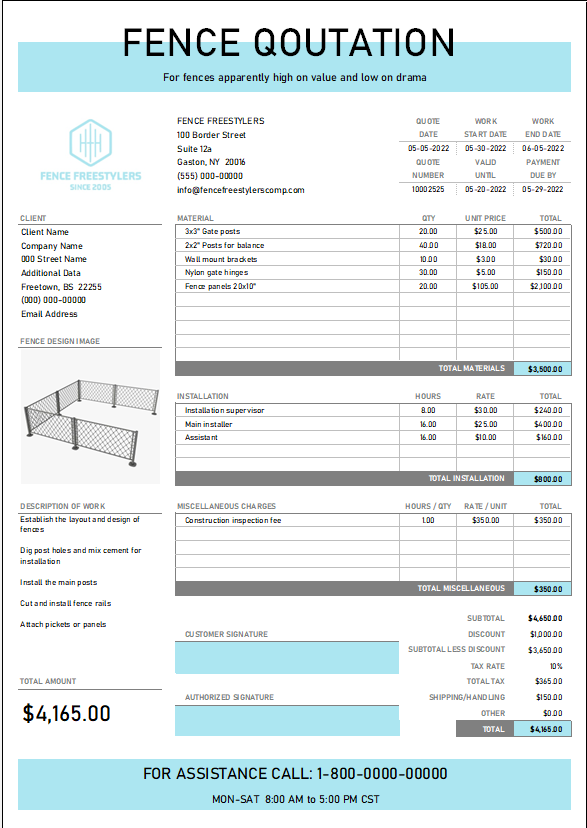
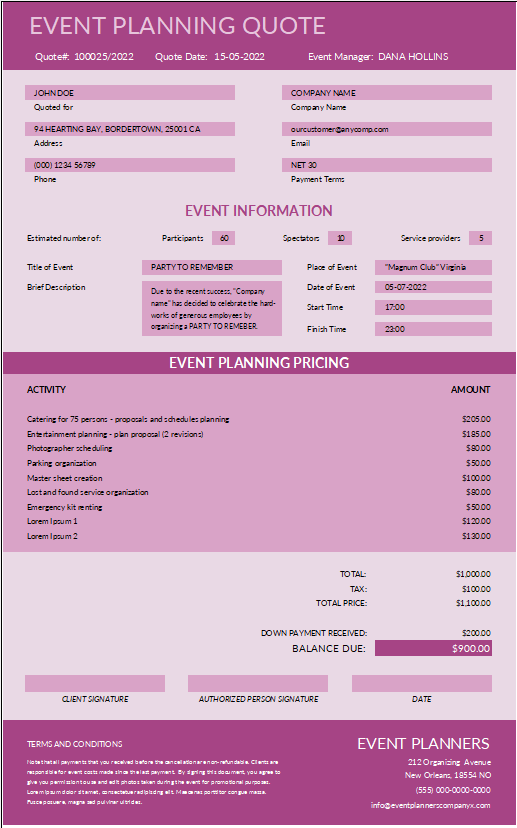
A Gantt Project chart is a commonly used graphical description and the portrait of a project schedule. It’s a type of chart arrangement showing the start and finishes dates of a project’s fundamentals such as resources, planning and dependencies. A horizontal bar chart is used in project management to visually represent and manage a project plan over time. Modern Gantt charts typically show you the timeline and —as well as who’s responsible—for each assignment and project. Similarly, it also contains a bar chart for more information about the project than a regular bar chart. This tool helps the project managers know what is happening in the project. The Gantt chart lets the project managers track the project’s progress.
How to Create a Gantt Project in EXCEL
What are some details a Gantt project chart enables you to catch-
- How a project splits down into each task
- When each task will begin and end and How long it will take
- Who’s assigned to each assignment
- How tasks relate to and depend on
- What are important meetings, approvals, or deadlines?
- How work is progressing in a plan
- Full project schedule from start to finish
Firstly, set up your project tracker details
Create project a name and start date, and select the days of the week you want to include in your assignment.
Add Position
Enter Start Date and End Date
Add important project milestones or activities– It makes it easy to track project deadlines, approvals, meetings, and other key deliverables or tasks.
Project Chart
Activity: Runs vertically down the left of the Gantt chart to describe project work.
Dateline: Highlights the current date on the Gantt.
Bars: Vertical markers on the right side of the Gantt chart that represent tasks and show the progress of activities.
Milestones: Blue bars that call out major events, length of activities monthly.
Progress: This Shows how far along work is.
Importance of a Gantt Project Management?
In project management, Gantt charts are used for planning and arranging projects. A Gantt chart is amazingly useful because it allows you to simplify complex assignments into an easy-to-follow plan and track the status of tasks. However, it also helps you keep track of project deadlines, milestones, and hours worked so you can spot and address delays.
The chart tells the resources and tools utilized on the assignment and helps the project team do the whole project in a task. The tasks derived from the main assignment are listed on the left side of the chart, and then the resources and dependencies. On the central part, it shows the task’s progress listed, telling how much work is completed.

