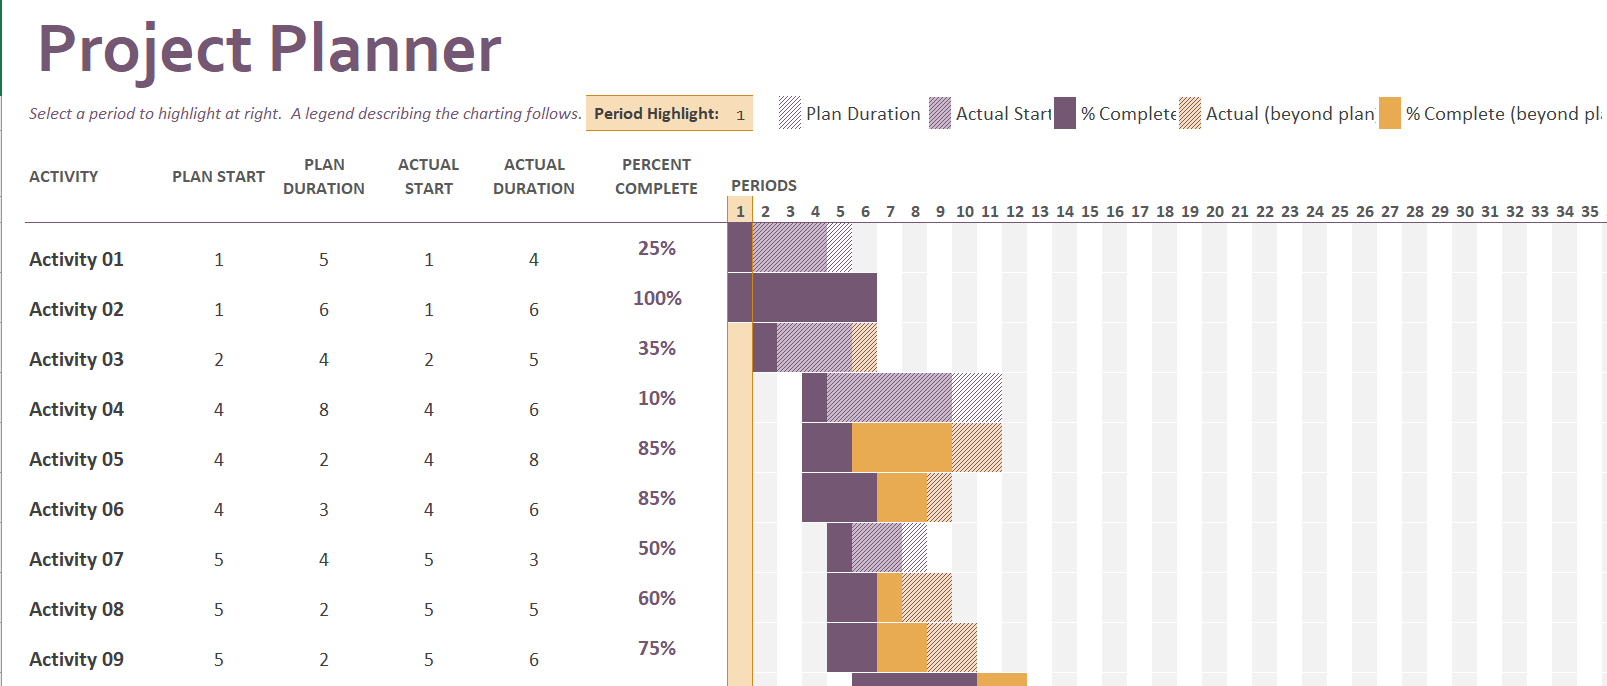
A Gantt planner is a project management tool assisting in the planning and scheduling of projects of all designs. This Gantt project makes a perfect project planner, allowing you to track and arrange the activities of a project. For instance, this project planning is a simple visual representation to show how a project will be managed. Gantt Chart is a tracking chart to illustrate the plans in graphical representation. This is the Best Chart to represent the Project Planner in a visually appealing graphical format. And it is most widely used in Project Management and Planning assignments. It helps managers and working teams to visually plan and track projects. And then it combines a table of tasks to be skilled in along with assignment details and timelines showing their result.
These are simple, free and easy to create and use, and display a considerable amount of information at a glance.
While Gantt charts are similar to timelines in that both diagram types deal with time and events, the format and purpose of every Gantt chart are quite different.
How to Create a Gantt Planner in EXCEL
A Gantt chart has three key parts: activities or tasks that are to be done, running along the y-axis; milestones or progress stages indicated along the x-axis and progress bars, denoted as horizontal bars, denoting how far along each assignment is at any given point.
Gantt Project Planner is used to track your project by different activities such as Plan Start and Actual Start, Percent complete, Plan Duration and Actual Duration.
The Steps are-
Add tasks and activities to your project-
Adding tasks to your Gantt chart is the first step in creating your project timeline.
Plan your tasks-
Now that you’ve got a full list of work to be done, it’s time to plan all those assignments. This task is super-simple because you can drag and drop each task on your timeline. Then simply click on the timeline below the date you’d like to program your task.
Add essential project milestones-
Adding milestones to your Gantt chart makes it easy to track project deadlines, approvals and meetings. It appears as a yellow diamond on your Gantt chart. For instance, to add this simply click on the Milestone link, give your new milestone a name, and drag the milestone icon across the Gantt chart to schedule it on the timeline.
Add dependencies to the assignments-
Now that your tasks and milestones are entered and scheduled, click the grey dot that appears.
Invite people to your project and assign tasks to them- Make a list of people who are already part of your project.
Highlight each Period
Apply colors to enhance visualization on your Gantt chart
Color is a great way to make your Gantt chart easy to understand.
Importance of using Gantt Planner
There are too many reasons why Gantt charts are loved throughout the project management world. Because it makes it easier to create complicated plans, especially those that involve multiple teams and changing deadlines. Gantt charts help teams to assign work around deadlines and properly allocate resources.
Projects planners also use Gantt charts to maintain their projects. In addition, they represent other things, the relationship between the start and end dates of tasks, milestones, and dependent tasks. Modern Gantt chart programs are Free Advanced Roadmaps synthesize information and illustrate the deadlines.

