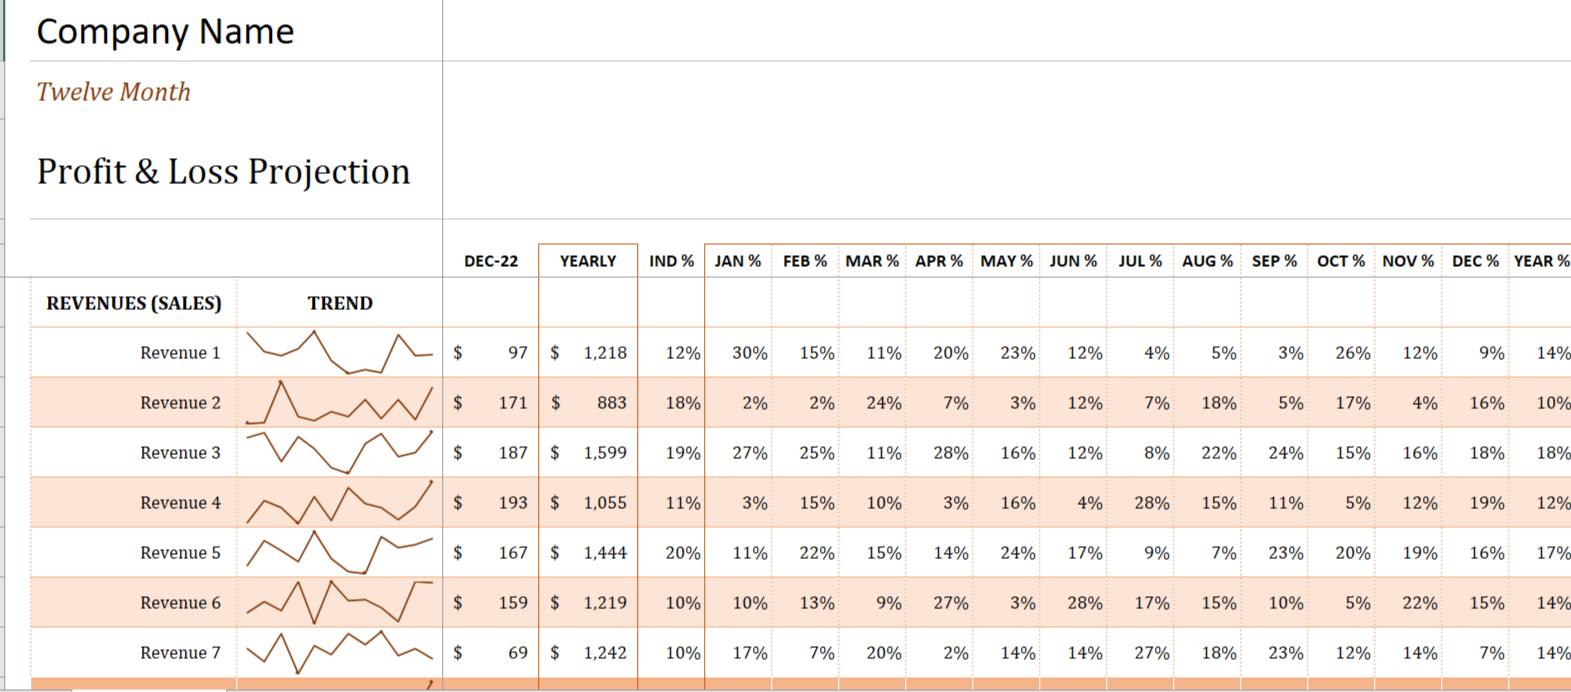
A profit and loss, or P&L, is a projection of how much money you make by selling services or how much profit you will make from these sales. In difficult times, your P&L Projection plays a major role in displaying what kind of a scheme you needed, so that you’ll be able to survive and gain profit for upcoming months. The P&L Projection shows an organization’s ability to produce sales, handle expenses, and create profits. P&L is a financial projection of a record that provides a summary of an organization’s income, revenues, expenses, and profits/losses.
How to use Profit and Loss Projection in Excel
Just simply add Enter Data on sales, income, taxes and expenses in the template.
The Profit and Loss Projection Spreadsheet helps you create a 4-year projection of income and expenses for your trade. It uses the same list of categories as the business budget, but also contains columns for calculating the Percentage of Total Sales, which helps you to analyze the cost of sold and operating expenses. This sheet contains two profit and loss templates that are planned for organizations providing services or selling. The worksheet includes a Cost of Stuff Sold section for recording purchase and calculating Gross Profit.
Use this profit and loss template below for a monthly cash flow analysis by changing the column from years to months.
What are the Main Functions of Profit and Loss Projection
The goal of the profit and loss Projection is to determine whether the business is making a profit or loss. In other words, it shows money spent or cost sustained in a company’s effort to generate revenue.
Profit and Loss A/c Statement
This component considers all the collateral expenses and incomes including the gross profit/loss to arrive at the net profit or loss.
You don’t need to major in accounting to have a successful Profit/Loss statement, and also you don’t want to rely 100% on your accountant to help you understand your P&L statement.
The things you’ll need to start to understand on your P&L report are:
Smart on the terms for inputs/outputs of P&L statement.
create a record on Profit and Loss report.
Find your net profit/loss per quarter or year.
Importance of Profit and Loss Projection
To calculate Net Profit
Your net profit is the essential figure you need to determine. The Net Profit is money left after paying your overhead costs. An organization’s Net Profit is Net Income, Net Earning or Bottom Line. Represents the Financial Standing of an organization after all the Expenses paid from the total Revenues.
For Net profit, make a list of your monthly fixed costs categories;
Employee’s Salary
Insurance
Accounting, Tax Preparation and Advertising
Bookkeeping
To estimate the Gross Profit
The word gross Sales is reflect the sales made during a year. Services uses, the word Gross or Revenue, which reflect the value of benefits provided during the year.
So, it is known as gross revenue as per the bills raised for that time and less refundable taxes in fewer returns. Sales return, and sales allotment are deducted from this gross sale to arrive at the net sales number.
For example, subtract your average monthly varying costs from your measured average monthly sales revenue to get your monthly gross profit. This calculates how much of each dollar of sales you get to keep. That amount, however, you’ll have to pay for overall expenses; then left over is your net profit.
EXAMPLE: Subtracting costs of $5,500 per month from her sales estimate of $10,000 per month, Emme estimates her new average monthly gross profit will be $6,500
To estimate Net Income
Revenue is income earned by a person or a company from the sale of any products or services offered. Revenue known as sales is an income statement that shows how well a business performs.
Estimates how much you’ll take sales in each month during the next 6 to 12 months. Further, if you’re already in business, you can generalize from existing sales levels and allow for significant variables.

