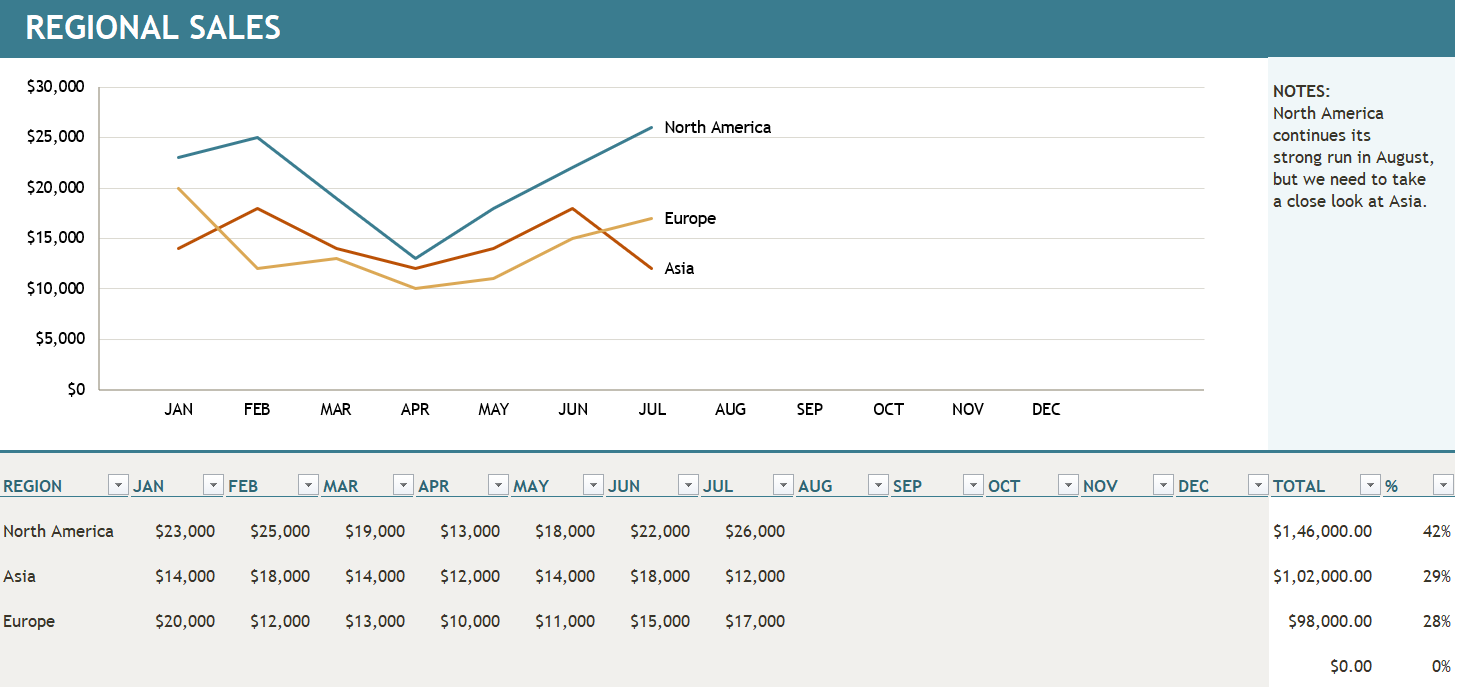
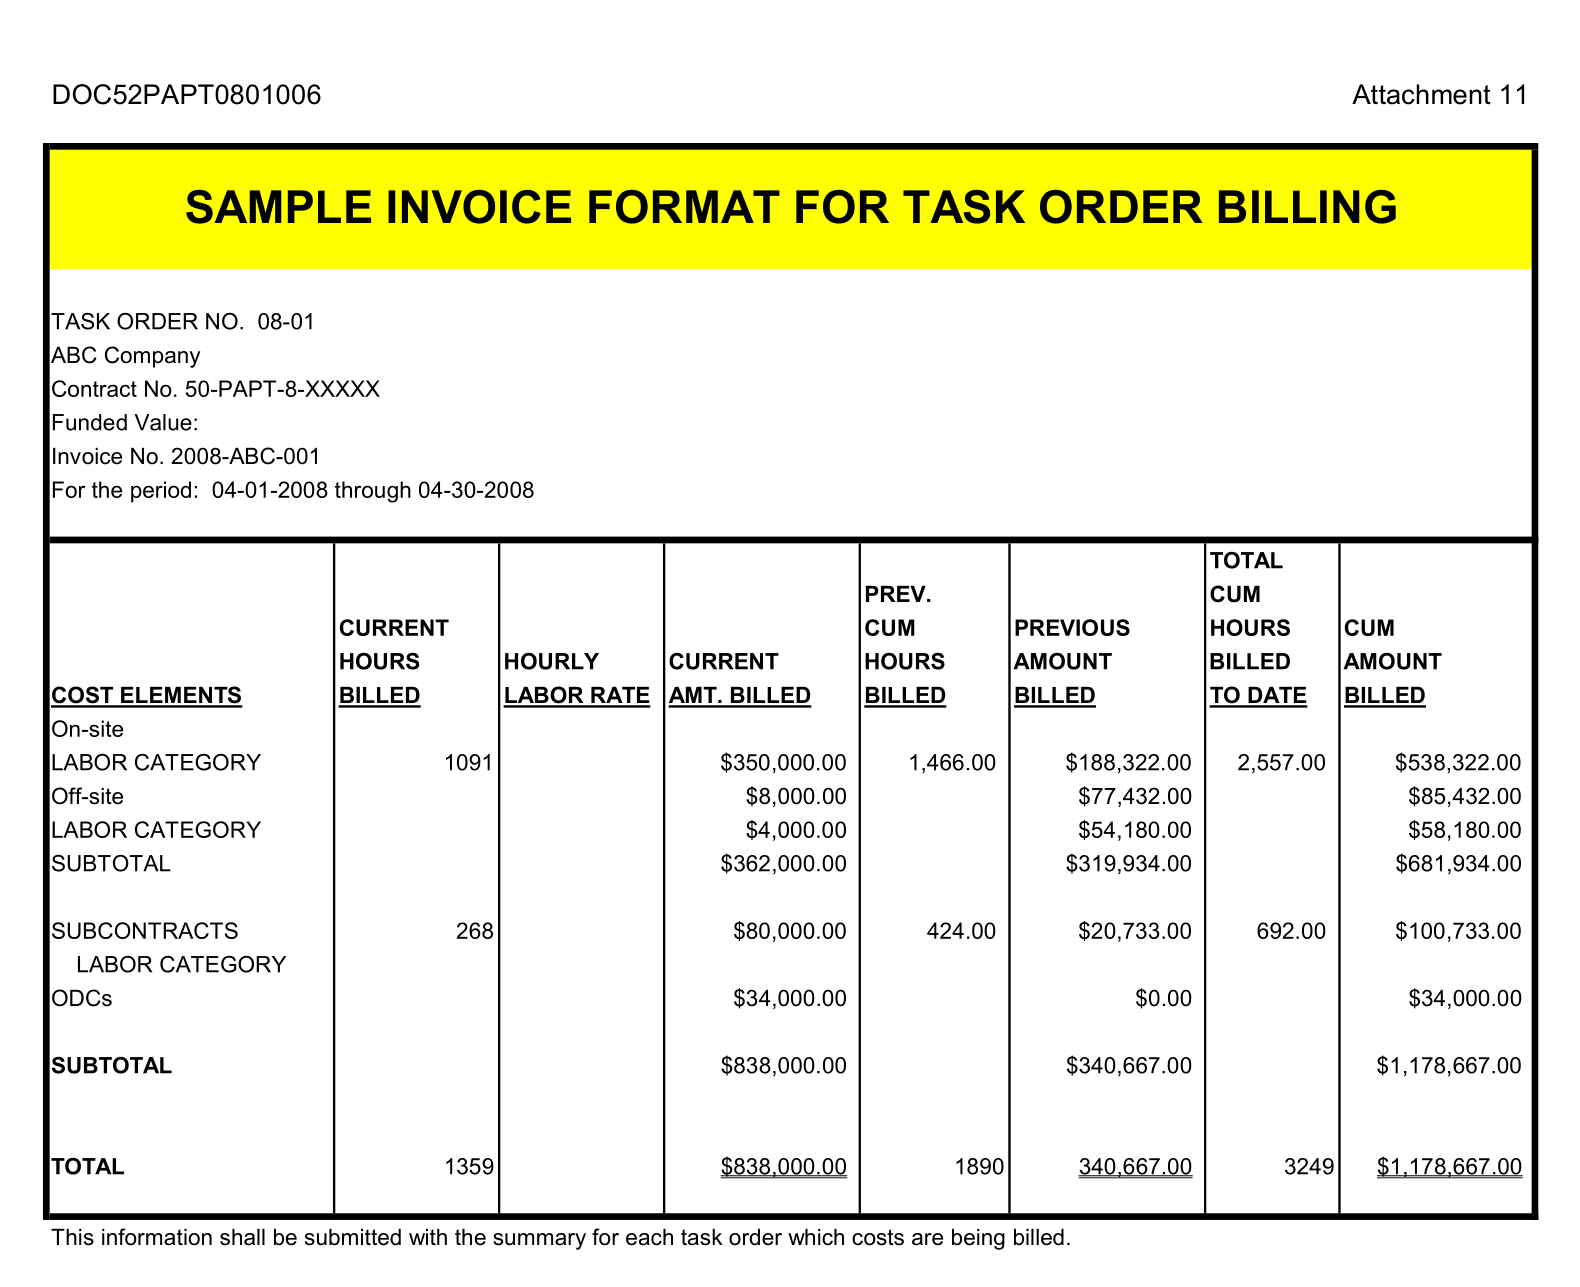
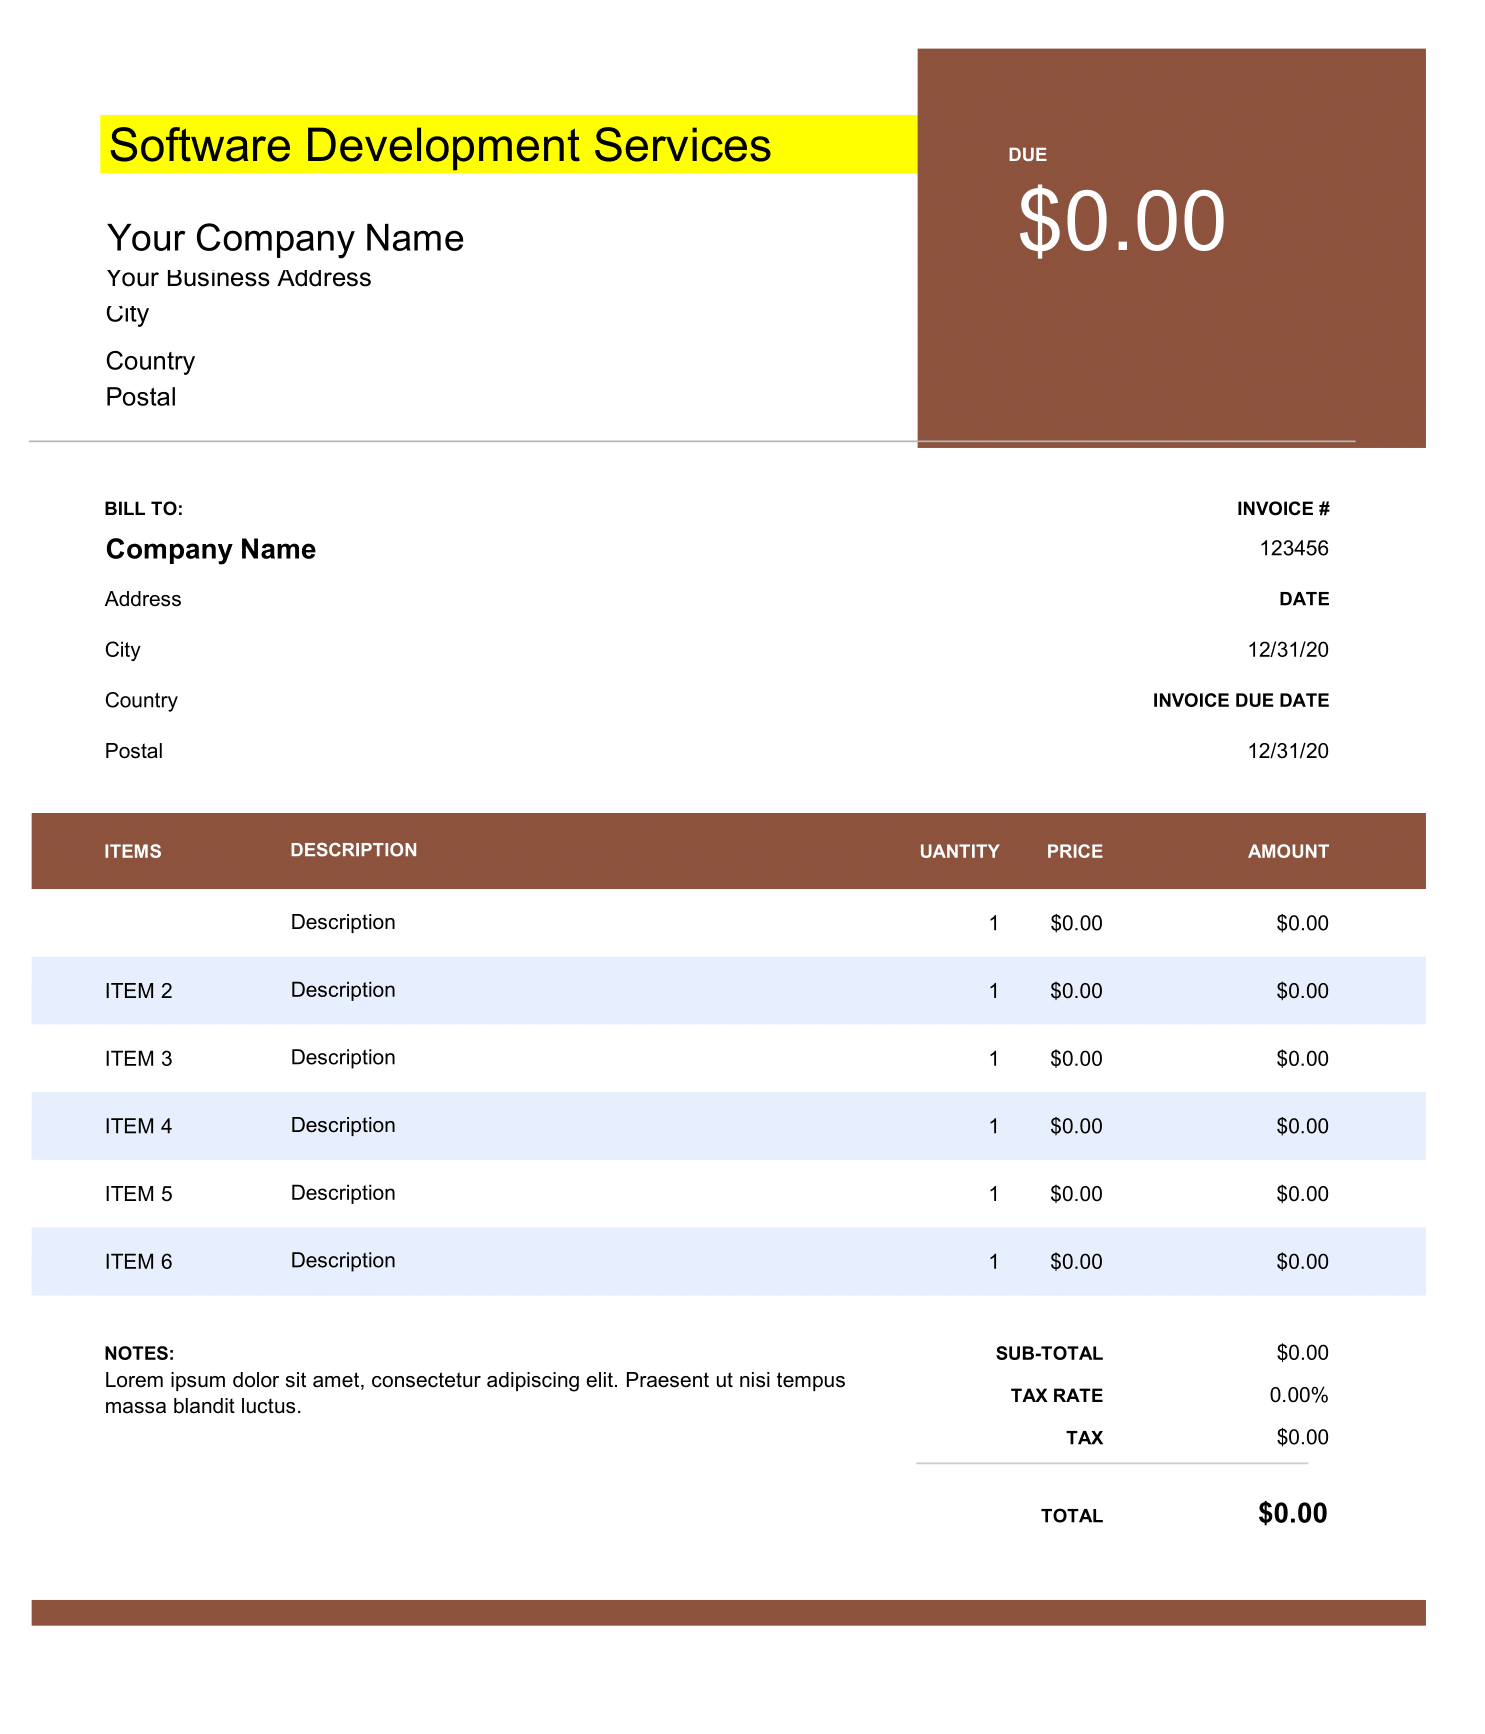
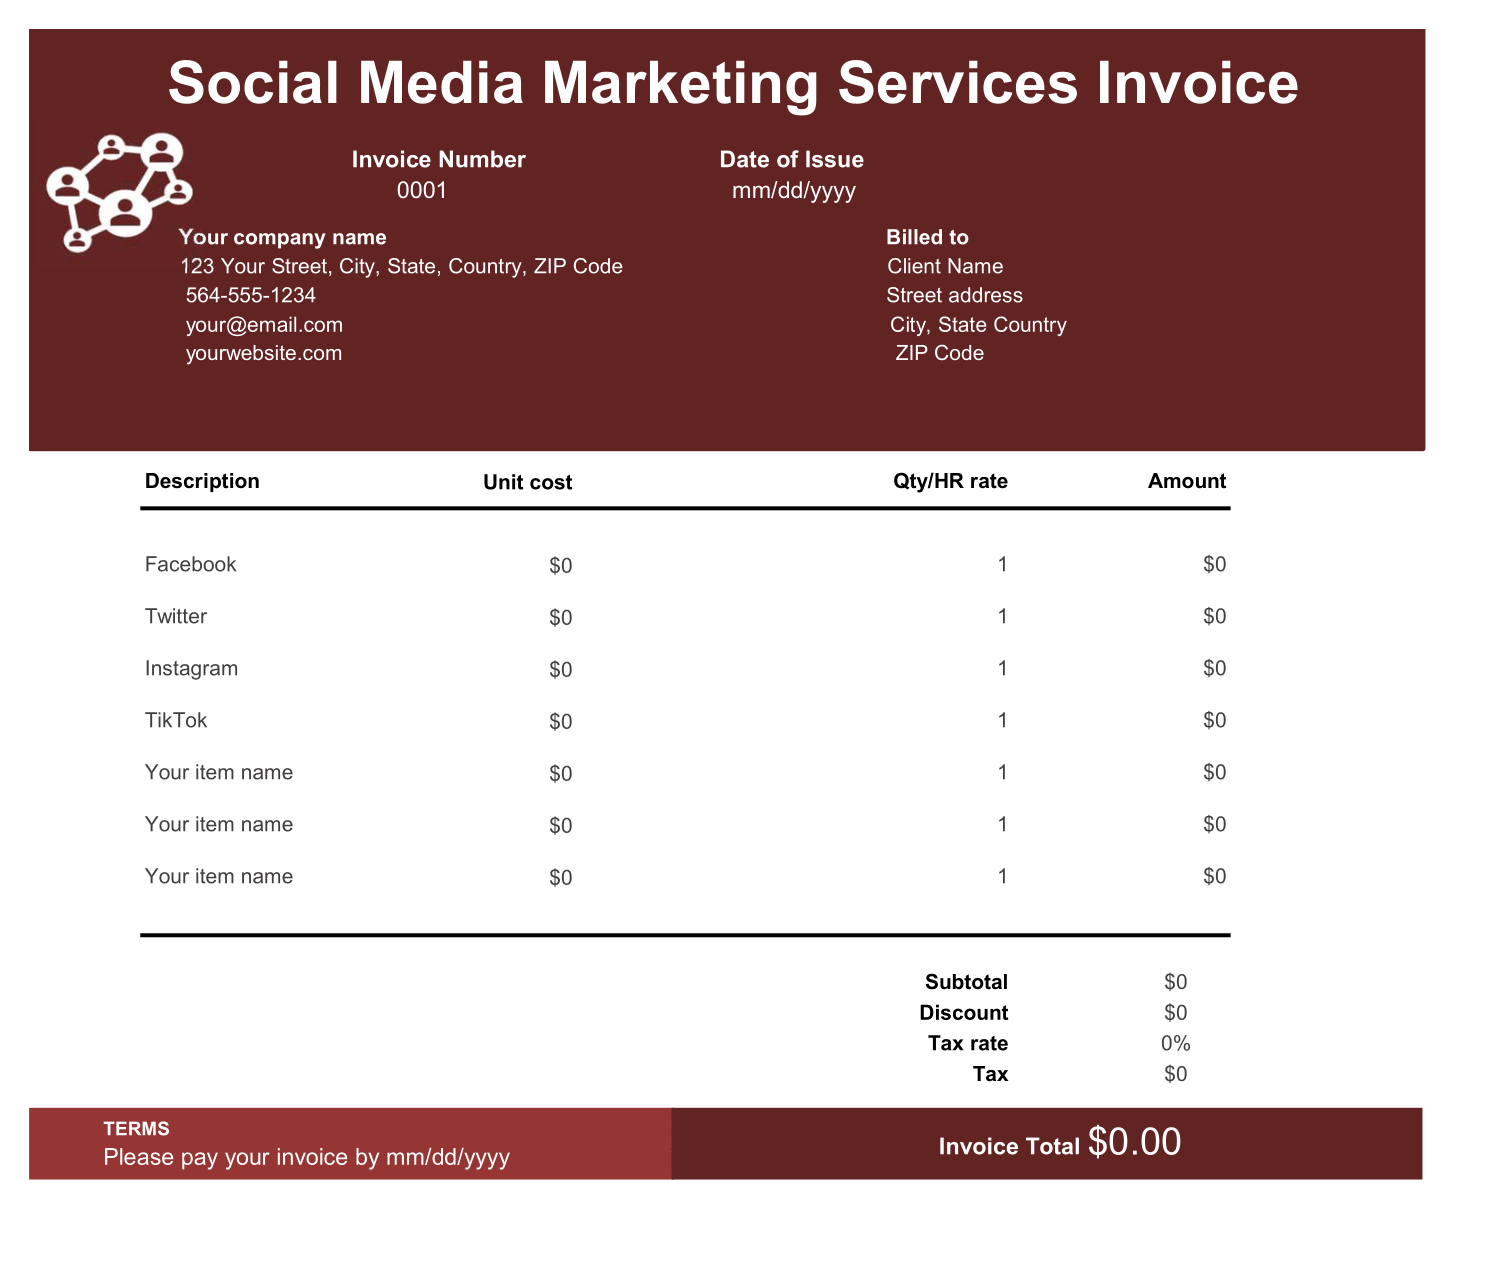
The regional sales chart represent graphically your sales. Input your data by region and month that creates charts it out for you
The Regional Sales Chart is a simple way to keep track of sales figures for multiple different market areas that contributes to your organization. A regional sales chart is a Register that records the distribution and sales of a company’s products or services throughout a particular region. Regional sales charts also decide on sales budgets, regional sales targets and pricing.
This worksheet is structured for you to quickly enter your sales figures and data projected onto a convenient line graph to give you an overview of all information. This worksheet basically, also provides a better understanding of who your target demographic is and how you can adjust your business strategy to that particular group of people.
How to Create a Regional Sales Chart
Sales are no longer about reaching data-driven decisions that result in genuine revenue-boosting opportunities in the company.
This excel chart explains how sales data analysis in Excel can be clarified. So, In this Template, we use a simple yet effective excel chart to present sales data from 3 different regions for easy comparison.
Download this excel sales chart sheet and replace the data and metrics with your own metrics. In addition, you can easily update this approach to suit your companies sales reports. Once you have the areas correctly filled out, enter the total sales figures for each region.
This worksheet here shows you a typical regional chart structure. Therefore It covers the important functional departments and a sales working team. For regional enterprises, some overseas offices are also included.
Importance of chart
- Regional Sales Chart Optimise your Performance
- Gives you Data about Customer Lifetime Value (CLV)
- Updates for Sales Target (Forecasted Revenue vs Actual Revenue)
- Provides Data about Customer Acquisition Rates

