Download Revenue Trend Charting Template In Excel

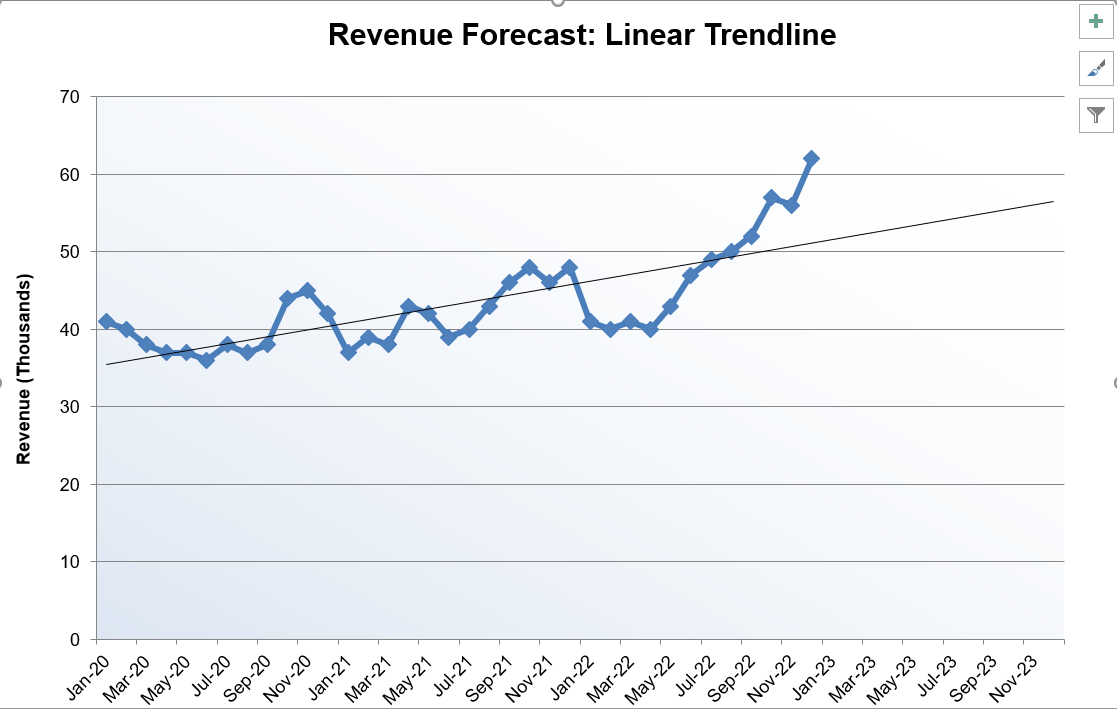
How to Create Revenue Trend Chart in Excel

A Revenue Trend Chart is a useful tool for tracking the growth of a company’s revenue over a period of time. It can be created using an editable Excel template, which allows you to input your baseline sales data and generate graphs with different trendlines, such as linear, power, and exponential.

To create a Revenue Trend Chart in Excel, you will need to understand the concept of variable values. The Y-value is the range or array of y values from the line equation for the Monthly Basis, while the X-value is the range or array of x values from the line equation. If the x value is null, Excel will assume the x-values as 10, 20, 30, etc. with the opposite of values as y.

Excel’s TREND function can be used to calculate the next month’s sales based on the historical data provided. The function uses the least-squares method to find the line of best fit, and the chart format allows for easy visualization of the data.

Revenue growth is important for a company as it can lead to increased sales, expansion of products and services, new opportunities, profitability, and benefits in valuation. Additionally, a company with a strong revenue growth chart can attract more customers.

There are several strategies that can be used to drive revenue growth, such as content marketing, email marketing, and offering premium versions of products. By tracking and analyzing revenue trends, managers and investors can make informed decisions about the financial growth of an organization.

Download Free Revenue Trend Chart Excel Template:

This free, editable Excel template is designed to help you analyze and track your company’s revenue over time. The template includes a line chart that displays revenue trends, as well as a table that shows the actual revenue numbers.

To download the template, simply click on the link provided. Once the template is open in Excel, you can enter your own data and customize the chart to fit your needs.

The template is easy to use and requires no prior knowledge of Excel. Simply enter your revenue data into the table, and the chart will automatically update to reflect the changes. You can also customize the chart’s appearance by changing the colors, font, and other formatting options.

The template is a great tool for business owners, managers, and financial analysts who need to track and analyze their company’s revenue. It can also be used by students or researchers who are studying business or finance.

Useful features of the template include:

  • Automatically updates chart based on data input
  • Customizable chart formatting options
  • Easy to use and understand
  • Can be used for multiple years data
  • Can be used to compare revenues of different departments/business units/product lines

You can download the excel template by clicking on this link: [Insert link to template]. This template is completely free and can be used for both personal and commercial use.

In conclusion, the Revenue Trend Chart Excel Template is a great tool for tracking and analyzing your company’s revenue over time. It is easy to use, customizable, and completely free. Download it now to start tracking your revenue trends and making data-driven decisions.

Download this Revenue Trend Charting template in Excel Format

Our easy to use editable Excel templates and save your significant amount of time and effort. Here’s how to download and use one of our templates:

  1. Download this free Excel Template: Once you’ve browsed through our collection of templates and find the one that best fits your needs. Once you’ve found the template you want, click on the download button.

  2. Replace sample data with your actual data: Once the template is downloaded, open it in Excel. You’ll see that it is already set up with sample data. To start analyzing your own data, simply replace the sample data with your actual data.

  3. Customize the template: Our templates are completely editable, which means you can customize them to fit your specific needs. For example, you can change the formatting, add or remove columns, or create new charts and graphs.

  4. Use the Excel template: Once you’ve fed in your data and customized the template, you’re ready to start using it for data analysis. Use the various tools and features of Excel to analyze and visualize your data, and make informed business decisions.

  5. Save and share: Once you’ve finished working on the template, save it to your computer and share it with other members of your team or stakeholders as needed.

Click Download Button To Get Revenue Trend Charting Excel Template

Instruction :

All Excel templates and tools are sole property of xlsxtemplates.com. User can only download and use the excel templates for their Personal use only. All templates provided by XLSX templates are free and no payment is asked. However, you are not allowed to distribute or share in any other website for sole purpose of generating revenue from it.

 You can also download and use our 1000 Best PowerPoint Presentation Templates and 500 Resume Samples from PPTXTemplates.com  Completely Free. All our templates are designed by Professionals

Download Free Editable Excel Templates | Popular Templates

Task Order Billing Format

Task Order Billing Format

Task Order Billing Format Template: Your Key to Efficient Milestone-Based Invoicing In a landscape where project dynamics shift and evolve, billing clients based on project

Read More »
Simple Tax Invoice

Simple Tax Invoice

In the realm of business, clarity, precision, and simplicity can be the key to smooth transactions. A Simple Tax Invoice Template is designed to cater

Read More »

Free editable professional Excel templates can be a useful tool for businesses, organizations, and individuals looking to streamline their data management and reporting processes. These templates can provide a pre-designed and pre-formatted framework for storing and organizing data, as well as for creating charts, graphs, and other visualizations to help communicate that data more effectively.

One advantage of using professional Excel templates is that they are often designed by experienced professionals who understand best practices for data management and visualization. This means that the templates are likely to be well-organized, easy to understand, and aesthetically pleasing, which can make working with them more efficient and enjoyable.

Another advantage is that these templates are often fully editable, allowing users to customize them to meet the specific needs of their organization or project. This can include adding or deleting rows and columns, changing the formatting and layout, and adding custom formulas and functions.

Some examples of professional Excel templates that may be available for free include budgeting templates for personal or business use, project management templates for tracking tasks and deadlines, and sales tracking templates for analyzing and forecasting sales data. There are also a wide variety of templates available for specific industries, such as real estate, marketing, human resource, Payroll management and among others.

Overall, free editable professional Excel templates can be a valuable resource for anyone looking to improve their data management and analysis skills. By providing a pre-designed and customizable framework for storing, organizing, and visualizing data, these templates can help users save time and make more informed decisions.