A sales forecast spreadsheet is an essential part of a business plan. It is also essential if you are looking to get a bank loan or investors. Our free Sales Forecasting tools in Excel Sheet lets you analyze and forecast the unit sales, growth rate, profit margin and gross profit. It provides a quick starting point for setting up your sales forecast and includes some sample charts.
Download Sales forecast excel template for computing sales projections
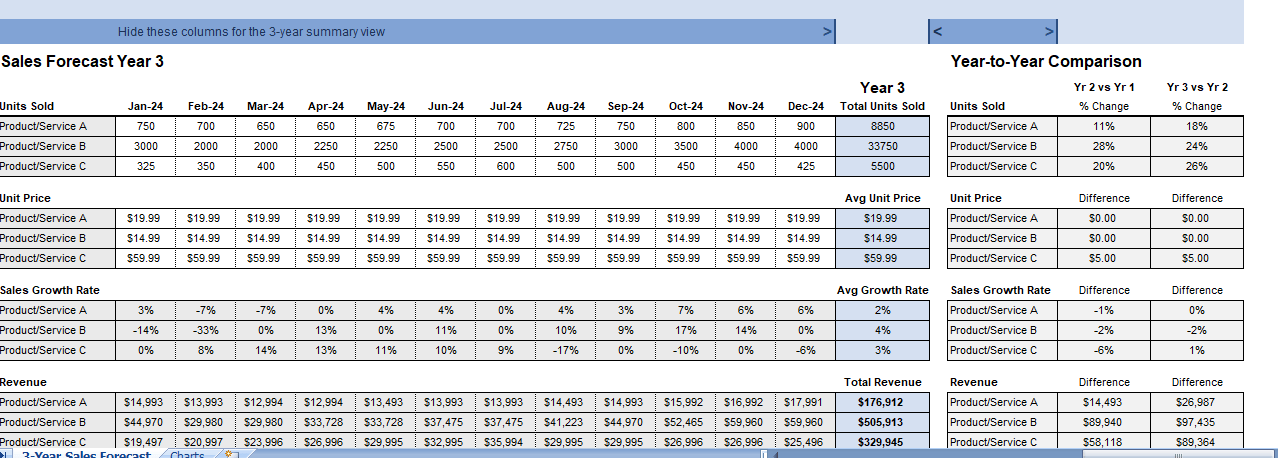
However this Excel spreadsheet lets you compare and analyze multiple products and services by entering monthly units sold, unit price and (COGS). The template then calculates the total revenue, growth rate, margin per unit, and gross profit.
Note: If your service is on an hourly rate, you can enter the number of hours under Units Sold and the hourly rate under Unit Price.
The final two columns compare the yearly totals for Year 2 vs Year 1 and Year 3 vs Year 2.
In a business plan or presentation, you should probably use a chart to help communicate your forecast. We’ve included a few sample charts, both for the first year’s data as well as all 3 years. Remember to use charts that effectively and accurately communicate your sales to lenders and investors. Certainly u can calculate your sales prediction.
Monthly or Yearly sales projection report
The spreadsheet is design to let you print a couple different types of reports using the same worksheet. If you make significant changes to the template. You will probably need to make adjustments with the Page Break Preview, page scaling, or other Page Layout options.
If you print the worksheet as-is, you will have each 12-month year on one page with the final page showing the yearly comparisons.
For a Year-to-Year summary on 1 page, you can hide the columns containing the monthly data prior to printing.
What is a sales forecast? A sales forecast is an expression of expected sales revenue. A sales forecast estimates how much your company plans to sell within a certain time period (like quarter or year). The best sales forecasts do this with a high degree of accuracy.
How to calculate sales projections?
Although different organizations can have vastly different sales structures and processes, the majority tend to use one or a combination of the following primary approaches to sales forecasting:
- Use of historical data to forecast future results. Looking at historical data is perhaps the most common as well as straightforward approach. The data is readily available, and it makes sense that variations based on factors like seasonality and new product introductions would provide directional insight.
- Funnel-based forecasting. For many companies, the current state of the sales funnel is viewed as the most accurate predictor of likely sales outcomes. As long as sellers are providing accurate and frequently updated information about the state of given pursuits, use of the funnel can be a reasonably reliable means upon which to make forecasts.
- Forecasting based on multiple variables. Given that both of the above approaches have inherent limitations, some organizations are looking to build more complex forecasting models that incorporate techniques that are likely to impact the closing of deals.

