Sales Forecast With Charts is a ready-to-use excel template that helps you forecast 3 years sales, growth rate, and profits of your products and services.
Moreover, it helps you analyze year on year forecast data and represent same in a graphical format.
The purpose of this sales projections is to know the sales of a particular product in the future in a specified market at a specific price.
Sales Forecast meaning
We have create a simple and easy Sales forecast template with charts and predefine formulas. Just enter your product-wise 3-year sales projections and compare them year on year basis.
Contents of Sales Forecast Excel Template With Charts
This template consists of 3 sheets; Sales Forecast Data Sheet, Printable Sales Forecast, and Sales Forecast Chart.
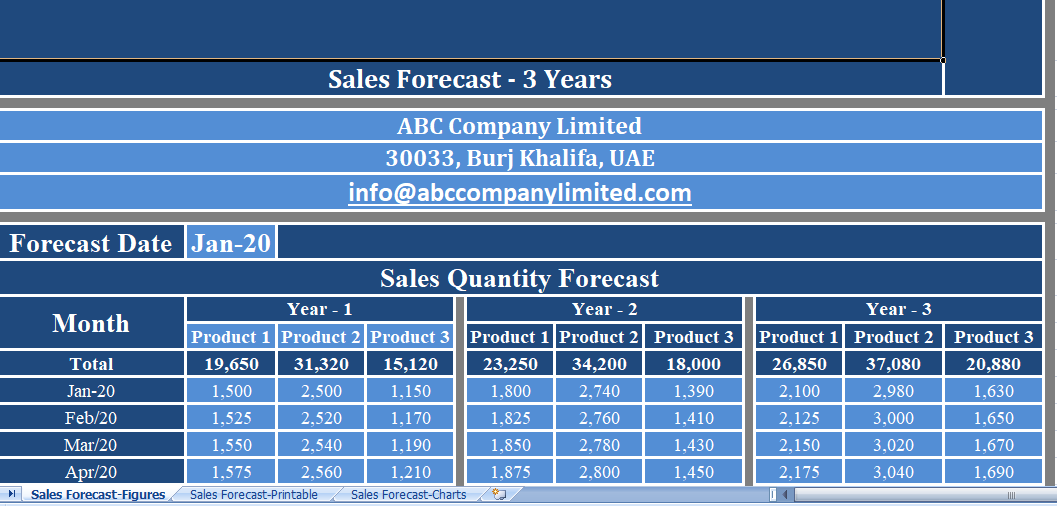
Sales Forecast Data Sheet
Enter company’s name, address, and email address. Insert the first date of Jan for the year you want to forecast.
In this sheet, there are 9 sections: Product-wise Quantity Forecast, Product Price Forecast, Growth Rate Forecast, Revenue Forecast, COGS Forecast, Margin Per Unit Forecast, Gross Profit Forecast, and Profit Percentage Forecast.
Product-wise Quantity Forecast
Enter the product name in the first three light blue cells. Thus, This will reflect the same in the whole sheet. You can also forecast unit sales of three products in this section. Insert unit sales for all three years.
Product Price Forecast
Insert forecast product price for all 3 products for 3 years.
This section displays Average yearly price at the top.
Growth Rate Forecast
No need to enter any data in this section. It consists of predefine formulas. At top, it displays the yearly average growth rate. Calculates growth rate month by month. It compares the rate with the previous month.
Revenue Forecast
Similar to above, in this section also consists of predefined formulas. So In the first row, it displays the yearly total revenue. The formula applied here is the Total sales unit multiplies by the product prices.
COGS Forecast
COGS is cost of goods sold. Insert COGS month on month for each product for all three years. This help you define your profit margin amount per unit in the next section.
At top, it displays the yearly average COGS.
Margin Per Unit Forecast
Margin per unit is Unit price minus COGS. This is also auto-calculate as it consists of predefine formulas.
At the top, it displays yearly average margin per unit.
Gross Profit Forecast
Gross profit is profit margin per unit multiplied by product quantity sold in the respective period. This section also consists of predefine formulas. Thus, no entry is to be made in this section.
At the top, it displays the yearly total gross profit.
Profit Percentage Forecast
This section displays the profit percentage forecast. The formula apply here is profit divided by revenue multiplied by 100.
At the top, it displays the yearly average profit percentage.
Year On Year Comparison
It compares all of the above heads for all three products with the previous year. It shows the increase or decrease compared to other products.
Sales Forecast Charts
This sheet consists of a graphical representation of the sales force Composite data for all 3 products.
It consists of following 3 sections: Product Quantity Forecast Charts, Revenue Forecast Charts, and Gross Profit Forecast Charts.
Product Quantity Charts
This sales forecast excel can be of great help to sales managers, team leaders and SME owners for 3 year’s Sales Forecast.