Unleash Your Sales Potential with Our Free Excel Sales Pipeline Template
We’re excited to introduce our new free Excel template for managing your sales pipeline, a tool that revolutionizes the way you track and analyze your sales process. This innovative solution not only offers a systematic approach for monitoring your sales activities but also includes a dynamic sales funnel chart that automatically adjusts based on the input data. But why is a sales pipeline crucial, and how can it aid your sales team? Let’s explore.
What is a Sales Pipeline?
A sales pipeline is a visual snapshot of where prospective customers are in the sales process. It offers a structured method for tracking potential clients as they progress through different stages of your sales cycle, from initial contact to the closing of a deal.
This pipeline serves as a strategic tool that can guide your sales team’s actions, enabling them to identify bottlenecks and pinpoint opportunities to drive sales growth. Essentially, it’s the roadmap your sales team needs to close deals more effectively and forecast future sales with greater accuracy.
The Importance This Template
- Improved Sales Visibility: A well-structured sales pipeline offers complete visibility into your sales process, making it easier to monitor leads and opportunities at each stage. This visibility allows your sales team to prioritize their actions effectively and focus on the deals most likely to close.
- Enhanced Forecasting: An accurate sales pipeline can be a powerful forecasting tool. By keeping track of the number of prospects at each stage and understanding the conversion rates, sales teams can predict future revenue more effectively. This can inform strategic planning and decision-making at various levels within the organization.
- Efficient Resource Allocation: A well-managed sales pipeline helps you understand which deals require more attention and resources. This can improve resource allocation, ensuring that your team spends their time and effort where it matters most.
- Performance Tracking and Improvement: A sales pipeline allows for the tracking of key performance indicators (KPIs), providing insight into the effectiveness of your sales process. This data can highlight areas for improvement and help develop strategies to increase conversion rates.
How Our Free Excel Sales Pipeline Template Helps Your Sales Team
Our free Excel sales pipeline template is designed to streamline your sales process. With it, you can:
- Track Progress: Our template provides a systematic way to monitor your sales process. Track leads, opportunities, customer interactions, and deals in one place.
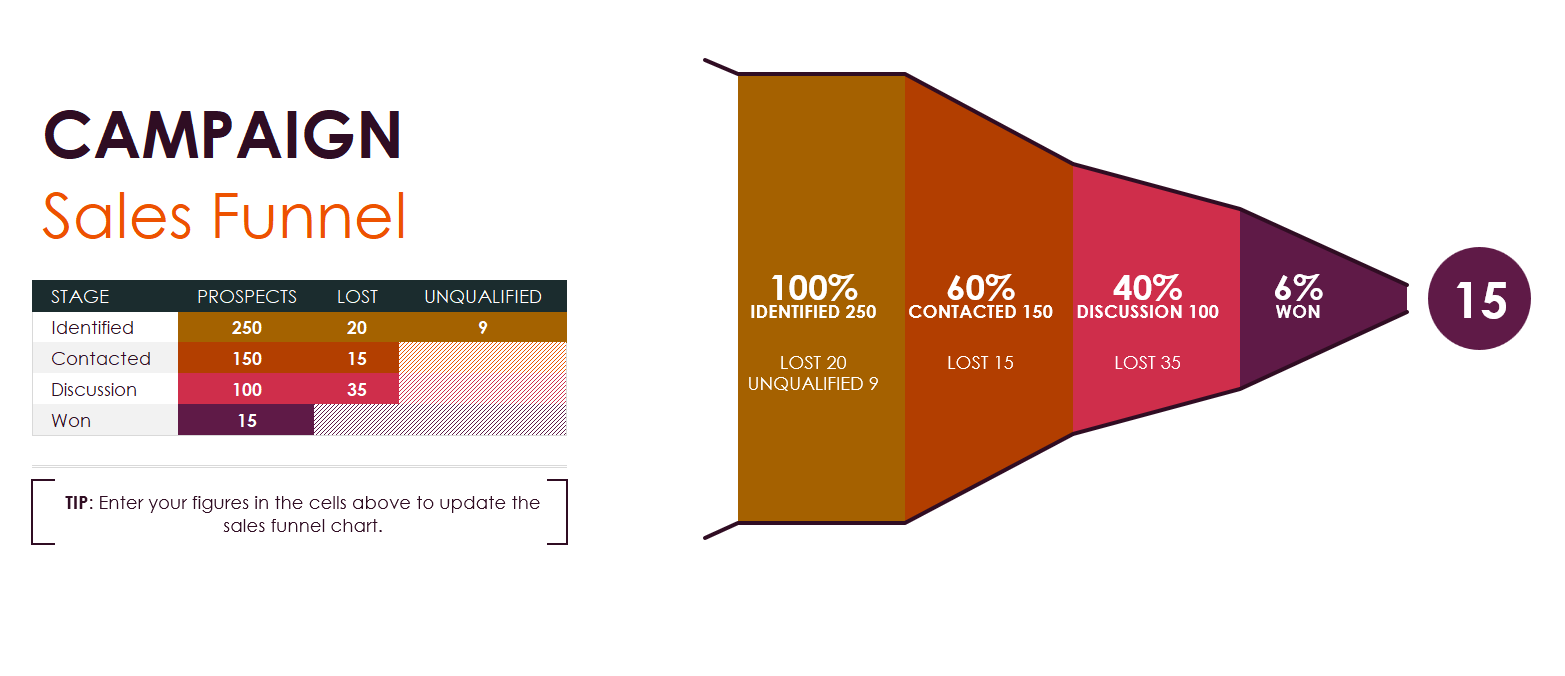
- Visualize Sales Funnel: The dynamic sales funnel chart that comes with our template auto-adjusts based on your input data. This visualization makes it easier to understand your sales process at a glance and identify any potential bottlenecks.
- Forecast Sales: By maintaining an updated sales pipeline, you can forecast future sales more accurately, making it easier to plan ahead and make informed decisions.
- Improve Productivity: With all your sales data organized in one place, your team can spend less time managing data and more time selling. The template’s user-friendly design makes it easy to update and maintain, boosting overall productivity.
In conclusion, a well-managed sales pipeline is integral to a successful sales strategy. Our free Excel sales pipeline template provides a comprehensive solution that can help your sales team stay organized, track progress, and ultimately close more deals. It’s an easy-to-use tool designed to empower your sales team and drive your business forward. Don’t miss out on this opportunity to elevate your sales process. Download our free Excel sales pipeline template today, and see the difference it can make!