School Statistical Register is an Excel Template that helps a school administration to maintain statistical data of students and with in-built Charts.
A school can easily access data as and when required in Tabular Formats and along with Charts in just a matter of clicks.
What is a School Statistical Register
Different types of data related to students studying in a school are demanded along with various levels viz. School and District Education Officer (DEO) level.
Therefore, From time to time it is also demanded by various other government authorities for different planning at a micro or macro level. So, The school must maintain these registers.
School Statistical Register Excel Template
Moreover, School Statistical Register is a ready-to-use excel template to maintain statistical data of students which is mandatory for schools with predefined formulas and formatting. Therefore, It classifies class-wise, gender-wise, religion-wise, and caste-wise data of students.
Contents
School Statistical Register is an Excel Template that consists of total of 6 sheets:
- Cumulative Student’s Data Entry Sheet.
- Religion-wise & Class-wise Report.
- Caste-Wise & Class-Wise Report.
- Gender-Wise & Class-wise Report.
- Cumulative School Data Chart Display.
- Class-wise Data Chart Display.
Therefore, The first sheet is for data entry, 3 display reports in tabular formats and last 2 display reports in various chart formats.
Please Note: Sheet bears two colors patterns; Navy Blue and Light Blue. Enter data only in Light Blue cells. Do not enter/alter any data in Navy Blue cells.
1. Cumulative Data – Data Entry Sheet
Thus, Cumulative Data – Data Entry Sheet is the main sheet of the template. So, You need to manually enter all the statistical data of students in this sheet.
Moreover, It accommodates class-wise data of the students. As a result, The entry of student’s data is made gender-wise, religion-wise and caste-wise.
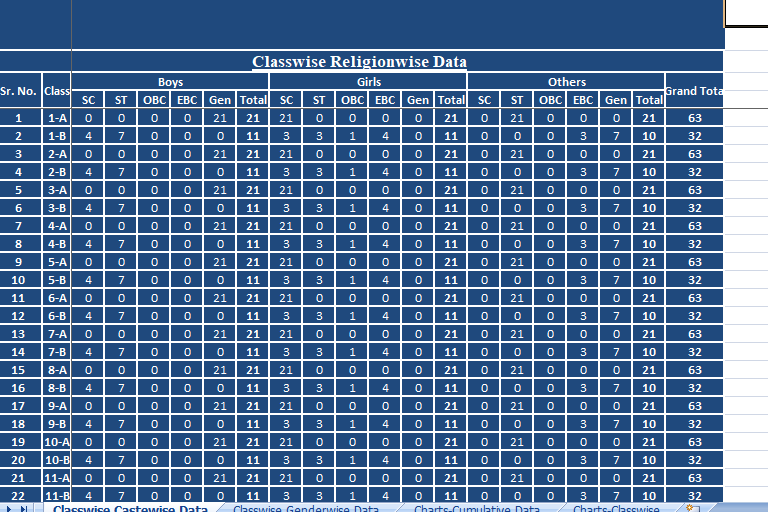
2. Religion-wise & Class-wise Report
As discussed earlier, Religion-wise & Class-wise Report is auto-generated. So, This sheet is cell linked with Cumulative Data – Data Entry Sheet.
Also, It fetches and displays the Class-wise strength of students depicting their classification based on their religion.
3. Caste-Wise & Class-Wise Report
Similarly, this template generates the Caste-wise & Class-wise report and fetches the data from the Cumulative Data – Data Entry Sheet.
It fetches and displays the Class-wise strength of students classifying based on the student’s Caste/Category.
4. Gender-Wise & Class-wise Report
The template also auto-generates Gender-Wise & Class-wise Report from the data enter in Cumulative Data – Data Entry Sheet.
It fetches Gender-Wise & Class-wise data from main sheet. It displays Gender-Wise & Class-wise data in tabular format based on the Gender.
5. Cumulative School Data Chart Display
Cumulative School Data Chart Display sheet reflects data of whole school 2 different Charts:
- School Strength Caste-wise and Gender-wise.
- School Strength Religion-wise and Gender-wise.
We have insert charts that fetch data and display it graphically. These charts are useful for Macro analysis.
6. Class-wise Data Chart Display
Class-wise Data Chart Display sheet reflects data of particular class and it bears three Charts:
- Gender-wise Class Chart
- Caste wise & Gender-wise Chart
- Religion-wise & Gender-wise Chart
So, These Charts and Data are useful for micro-analysis.
So, In this sheet, at the top on the left side, a Light Blue Cell with heading Class is given. Just enter the Class and Division in the same fashion as it is written in the Cumulative Data – Data Entry Sheet.
Thus, It fetches data of that particular class and division which you entered. Moreover, It generates the class-wise report and chart for you in a blink with the help of the VLOOKUP function of excel.
Benefits of Using School Statistical Register Excel Template
By using School Statistical Register we have the following benefits:
- Easy Accessibility of Data.
- Proper Scrutiny
- Time-Saving.
- Professional display of data.
- Micro-level scrutiny.
- Easy multiple report generation.
- Data display of data with Charts.

