Master Project Management with Our Automated Dashboard Template in Excel
Managing a project can be a daunting task, especially when juggling multiple projects at once. But, with the right tools, project management can become a breeze. One such tool that can streamline your project management process is our Automated Project Management Dashboard Template in Excel. It is fully customizable, user-friendly, and what’s more, it’s free to download from our website.
What is the Automated Project Management Dashboard Template?
Our automated project management dashboard template is an advanced excel tool designed to make project tracking more efficient. It is more than just a simple excel sheet; it is a dynamic and interactive tool that allows you to visualize your project status in real-time.
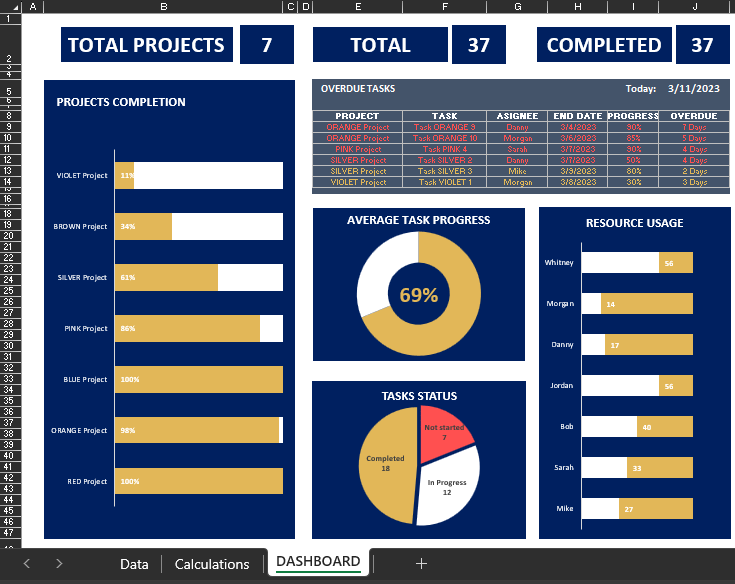
The dashboard includes project-wise status of completion in a bar graph, details of overdue tasks, average task progress, resource utilization bar chart, and task status pie chart. All of these features provide a comprehensive, bird’s-eye view of your project’s status at a glance.
Behind the scenes, there is a detailed excel sheet where all your data input is fed. Based on this data, all the calculations and graphics on the dashboard are updated automatically.
Key Features of the Dashboard
1. Project Status Bar Graph
Monitor the progress of each project in real-time, using an easy-to-understand bar graph. Visualize your project completion status instantly.
2. Overdue Tasks Details
Never miss a deadline again. Keep track of all overdue tasks in one place. This feature will help you prioritize tasks and maintain efficiency.
3. Average Task Progress
Stay up-to-date with how your tasks are progressing on average. This feature helps to identify any bottlenecks or delays in your projects.
4. Resource Utilization Bar Chart
Ensure optimal resource allocation and efficiency with the resource utilization bar chart. This helps you to maximize productivity and prevent resource wastage.
5. Task Status Pie Chart
Track the status of all your tasks with this comprehensive pie chart. Instantly determine which tasks are completed, pending, or in progress.
Benefits of Tracking Your Expenses
Project expense tracking is a crucial aspect of project management, and it is made effortless with our automated dashboard. Understanding where your resources are being spent helps maintain control over your budget and prevent overspending. It can also help you identify areas where you can save or need to invest more.
Here are some benefits of tracking your expenses:
Improved Financial Control
By consistently monitoring your expenses, you can maintain control over your project’s budget. It reduces the chances of unexpected costs, helping you plan better for the future.
Cost-saving Opportunities
Regular expense tracking can highlight areas where costs could be minimized or eliminated. This information is crucial for efficient budget management and can result in significant cost savings.
Enhanced Decision Making
Knowing where your money goes can help you make informed decisions about resource allocation and prioritization. This can have a direct impact on the success of your project.
In conclusion, an automated project management dashboard like ours not only makes your work easier but also increases the chances of your project’s success. So, why wait? Download our free Automated Project Management Dashboard Template in Excel today and streamline your project management process. With this dashboard, you can say goodbye to manual tracking and hello to hassle-free project management.
How to Use the Automated Project Management Dashboard Template
Getting started with our automated dashboard is simple and requires no technical expertise. Here’s a step-by-step guide to help you get the most out of this tool.
Step 1: Download and Open the Template
Visit our website and download the Automated Project Management Dashboard Template in Excel for free. Once downloaded, open it, and you’ll find two main sheets: the Data Input sheet and the Dashboard.
Step 2: Input Your Data
The Data Input sheet is where you’ll input all your project-related data. This includes project names, task details, status, deadlines, resources, and expenses. Make sure to fill in all the fields for accurate calculations and visualizations.
Step 3: Navigate to the Dashboard
Once you’ve inputted your data, head over to the Dashboard. It will be automatically updated based on the data you’ve provided.
Step 4: Understand Your Dashboard
The Dashboard displays several key indicators. The project status bar graph shows the progress of your projects, the overdue tasks details show tasks that have surpassed their deadlines, the average task progress indicates the overall progress, the resource utilization bar chart shows how efficiently resources are being used, and the task status pie chart shows the status of all tasks.
Maximizing the Value of the Dashboard
Our Automated Project Management Dashboard is more than just a tracking tool—it’s a strategic asset. By effectively using this tool, you can maximize the success of your project.
Regularly Update Your Data
Ensure you regularly update your Data Input sheet for real-time project tracking. This allows you to swiftly respond to any changes and maintain the efficiency of your project.
Analyze Your Data
Don’t just track your data—analyze it. Use the insights from the dashboard to understand project progress, identify bottlenecks, and improve project execution.
Use It as a Communication Tool
Our dashboard isn’t just for managers—it’s a communication tool for your entire team. Share it with team members to keep everyone on the same page about project progress and expectations.
In today’s fast-paced, multitasking world, an automated project management dashboard is a boon. It simplifies project management, boosts productivity, and facilitates decision-making. Download our free Automated Project Management Dashboard Template in Excel today and experience the difference for yourself. Say hello to a new era of efficient project management!

