Engineering graph paper is used to help professionals, such as engineers and architects, to draft out their ideas and mathematical equations using gridlines as a guide. The worksheets in this template provide engineering graph paper at 3 different scales – 0.25”, 0.2”, and 0.1”.
Engineering Graph Contents
0.25 Inch
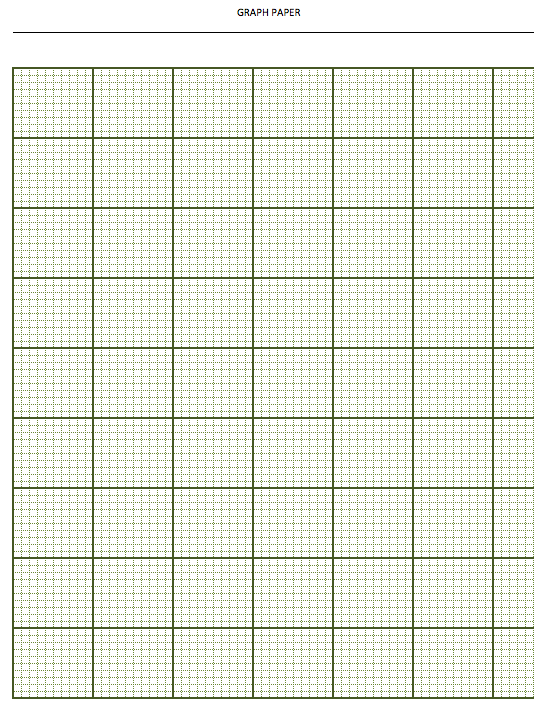
Engineering graph paper green grid lines at 0.25 inch scale (within 1 inch scale grid) in portrait orientation.
0.2 Inch
Engineering graph paper with green grid lines at 0.2 inch scale (within 1 inch scale grid) in portrait orientation.
0.1 Inch
Engineering graph paper with green grid lines at 0.1 inch scale (within 1 inch scale grid) in portrait orientation.
Using The Template
Personalize and Print Graph Paper
Add personal touch! Each worksheet has a built-in header. Use header to include information, such as name, title, and date.
If you prefer to draw by hand, just print – each tab is configured to print in its appropriate orientation type.
Working in Excel
Design a Floor Plan
You can create building design or floor plan with ease by using the smaller (.2 inch) grid and larger 1 inch grid to draw design to scale in Excel.
To create a similar floor plan – first, you have an idea of the dimensions of the structure you’d like to design and list a scale-to-size somewhere on the drawing. Next, use “Fill Color” tool to color code each room in building.
Highlight a specific area. Then, go to “Home” menu and select “Fill Color” icon to choose a color.
Next, label area by inserting a text box into the colored area, defined as a “room”.
The new textbox will have white background and a frame. To eliminate or change background color and lines, right click on textbox and click “Format Shape” to change textbox format.
Create Landscape Architecture Plans
You can use engineering graph paper in Excel to design a landscape architecture plan for a backyard nature oasis!
To create similar landscape plan – first, measure your outdoor spaces and include a scale-to-size somewhere on the drawing.
Next, highlight a specific area. Then, go to “Home” menu and select the “Fill Color” icon to choose a color.
Continue to draw spaces using the “Fill Color” tool.
Next, create labels with lines and textboxes by choosing the “Insert” menu and selecting “Illustrations”, then “Shapes” to find lines, text boxes, circles.
To create a pond feature, choose “Chord” shape under “Basic Shapes” – this will allow you to modify shape into a half-circle by dragging the edges of the shape.
Icons like trees can be found under the “Insert” menu. Select “Illustration”, and then “Icons” to find your icon.
Create Basic Charts
Plot points and linear objects can be inserted into graph paper to help with plots and drawings. To use linear objects, select “Illustrations”, and then select “Shapes”, under the “Insert” menu. This gives you an option to include a line or a shape with greater precision by using the graph.
For geometric or algebraic requirements, plot out graph by drawing an X-axis and Y-axis (Home menu, “draw border”) and then number them. Points can also be plotted out by using “Basic Shapes” as points.
Customize
Engineering Paper Grid Size
The largest grid scale option in the engineering graph paper template is .25”. But what if you need to work at .5” scale? You can!
Modify Grid Units
Want to draw to scale using the metric system, instead of the imperial system? You can modify the units originally display in this grid template by switching from inches to centimeters. To do this – go to the “File” menu and select “Options”. Next, select “Advanced” and scroll down to the “Display” settings. Finally, select appropriate unit (e.g. Centimeters) from the “Ruler Units” dropdown menu. This will now allow you to modify grid scale in newly selected unit of measure.

