Download Fishbone Diagram Template In Excel

Fishbone Diagram is another name for the Ishikawa Diagram or Cause and Effect Diagram. It gets its name from the fact that the shape looks a bit like a fish skeleton. A fish bone diagram is a common tool for a cause and effect analysis, where you try to identify possible causes for a certain problem or event. The following downloads may help you get started, and if you continue reading, I’ve included some detailed information about how to use the diagrams.

Ishikawa Diagram

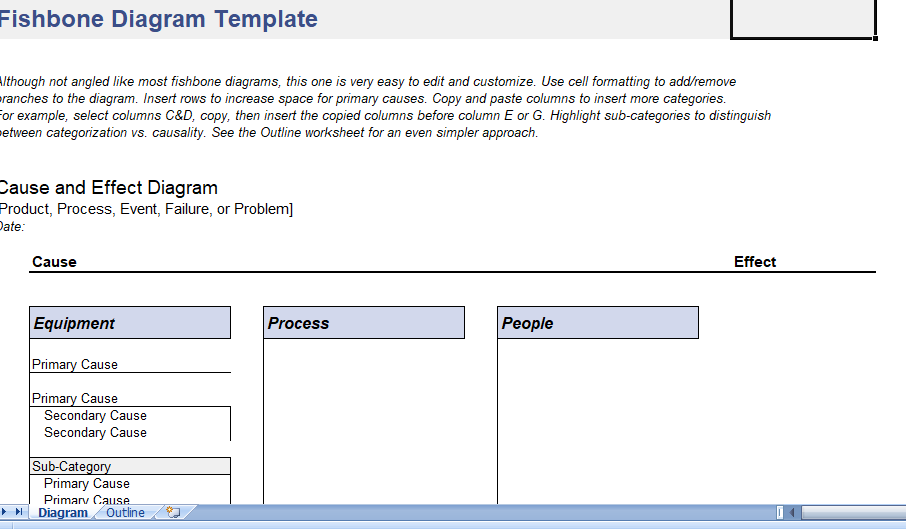
Create a cause and effect diagram with a spreadsheet. Although not angled like most fishbone diagrams, this template is very simple to edit and customize (as opposed to constantly moving and aligning text boxes and arrows).

  • Use cell formatting to add/remove branches to the diagram.
  • Insert rows to increase space for primary causes.
  • Use text indenting within a cell for secondary or tertiary causes
  • Copy and paste columns to insert more categories.

The Outline worksheet included in the workbook (screenshot not shown) is even simpler to use. It organizes the diagram into an outline view that is much easier to edit on the fly.

Cause and Effect Fishbone Diagram

The purpose of a cause and effect analysis is to identify the causes, factors, or sources of variation that lead to a specific event, result, or defect in a product or process. A fishbone diagram is simply a tool to be used along with Brainstorming and the 5 Whys.

The various causes are grouped into categories and the arrows in the image below indicate how the causes cascade or flow toward the end effect. Due to its simplicity, the diagram is often drawn on a white board during a brainstorm session. I designed the above template so that it would easy for someone familiar with Excel to use during a meeting to record the ideas as they are discussed.

Steps to Using a Cause and Effect Diagram

  1. Define the Effect: Be specific.
  2. Choose Categories: The template is set up with the most common set of categories, but you can add or remove categories based on your specific case. See the example categories below.
  3. Brainstorm Possible Causes: Using the diagram while brainstorming can both broaden and focus your thinking as you consider the various categories in turn.
  4. Ask Why?: You really want to find the root causes, and one way to help do that is to use the 5 Whys technique: asking “Why?” or “Why else?” over and over until you come up with possible root causes. “Improper handling” is not a root cause, while “Failing to wear Latex gloves” might be closer to a root cause. But, you could still ask “Why was he/she not wearing gloves?” with the possible response “There were none available.” It is a lot easier to take action against the inventory problem than just the generic “improper handling”.
  5. Investigate: Now that you’ve come up with possible causes, it is time to go gather data to confirm which causes are real or not.

Common Categories in a Fishbone Diagram

The M’s The P’s
(Service Industry)
The S’s
(Service Industry)
Machine (Equipment)
Method (Process)
Man Power (People / physical labor)
Material
Mother Nature (Environment)
Management (Policies)
Measurement (Inspection)
Maintenance
Marketing (Promotion)
Plant/Place
Process
People
Policies
Procedures
Price
Promotion
Product
Surroundings
Supplies
Systems
Skills

Categorization vs. Causality

During a brainstorm session, this diagram is usually used very loosely, meaning that sometimes branches (what I have labeled as primary and secondary causes in the diagram below) may actually represent sub-categories of causes rather than actual causality.

When a cause and effect diagram is used to represent causality, then the primary and secondary branches taken on very specific meanings:

Primary Cause is one that could lead directly to the effect. For example, a light bulb that burns out pre-maturely (the effect) might be caused by a sudden jarring motion such as dropping, which might be listed under the category People if it was associated with handling by a person (as opposed to machine handling).

Secondary Cause is a cause that could lead to a Primary Cause, but does not directly cause the end effect. For example, the cause slippery hands doesn’t make the bulb burn out, but it could lead to the light bulb being dropped. So slippery hands would be listed as a secondary cause under dropping.

Download this Fishbone Diagram template in Excel Format

Our easy to use editable Excel templates and save your significant amount of time and effort. Here’s how to download and use one of our templates:

  1. Download this free Excel Template: Once you’ve browsed through our collection of templates and find the one that best fits your needs. Once you’ve found the template you want, click on the download button.

  2. Replace sample data with your actual data: Once the template is downloaded, open it in Excel. You’ll see that it is already set up with sample data. To start analyzing your own data, simply replace the sample data with your actual data.

  3. Customize the template: Our templates are completely editable, which means you can customize them to fit your specific needs. For example, you can change the formatting, add or remove columns, or create new charts and graphs.

  4. Use the Excel template: Once you’ve fed in your data and customized the template, you’re ready to start using it for data analysis. Use the various tools and features of Excel to analyze and visualize your data, and make informed business decisions.

  5. Save and share: Once you’ve finished working on the template, save it to your computer and share it with other members of your team or stakeholders as needed.

Click Download Button To Get Fishbone Diagram Excel Template

Instruction :

All Excel templates and tools are sole property of xlsxtemplates.com. User can only download and use the excel templates for their Personal use only. All templates provided by XLSX templates are free and no payment is asked. However, you are not allowed to distribute or share in any other website for sole purpose of generating revenue from it.

 You can also download and use our 1000 Best PowerPoint Presentation Templates and 500 Resume Samples from PPTXTemplates.com  Completely Free. All our templates are designed by Professionals

Download Free Editable Excel Templates | Popular Templates

Insurance Quote Template

Insurance Quote

Introduction: Streamlining Insurance Quotations An insurance quote is a vital document in the insurance industry, serving as a preliminary estimate of premiums for potential clients.

Read More »
Freelance Quotation Template

Freelance Quotation

Introduction: Mastering Freelance Quotations In the world of freelancing, creating an effective quotation is crucial for outlining the scope and cost of your services to

Read More »
Fencing Quotation

Fencing Quotation

Introduction: Navigating Fencing Service Quotations A fencing service quotation is an essential tool for businesses in the fencing industry. It provides potential clients with a

Read More »
Event Planning Quote

Event Planning Quotations

Introduction: Excelling with Event Planning Quotations An event planning quote is a critical document for event planners, detailing proposed services and costs for organizing an

Read More »
Construction Quote Template

Construction Quote

Introduction: Optimizing Construction Quotations A construction quote is a fundamental document in the construction industry, serving as a formal proposal of costs for construction services

Read More »
Cleaning Quote

Cleaning Quote

Introduction: Perfecting Cleaning Service Quotations Creating an effective cleaning service quotation is crucial in the cleaning business. It serves as a formal proposal outlining the

Read More »

Free editable professional Excel templates can be a useful tool for businesses, organizations, and individuals looking to streamline their data management and reporting processes. These templates can provide a pre-designed and pre-formatted framework for storing and organizing data, as well as for creating charts, graphs, and other visualizations to help communicate that data more effectively.

One advantage of using professional Excel templates is that they are often designed by experienced professionals who understand best practices for data management and visualization. This means that the templates are likely to be well-organized, easy to understand, and aesthetically pleasing, which can make working with them more efficient and enjoyable.

Another advantage is that these templates are often fully editable, allowing users to customize them to meet the specific needs of their organization or project. This can include adding or deleting rows and columns, changing the formatting and layout, and adding custom formulas and functions.

Some examples of professional Excel templates that may be available for free include budgeting templates for personal or business use, project management templates for tracking tasks and deadlines, and sales tracking templates for analyzing and forecasting sales data. There are also a wide variety of templates available for specific industries, such as real estate, marketing, human resource, Payroll management and among others.

Overall, free editable professional Excel templates can be a valuable resource for anyone looking to improve their data management and analysis skills. By providing a pre-designed and customizable framework for storing, organizing, and visualizing data, these templates can help users save time and make more informed decisions.