The Polar Vortex comes down every so often, making us reach for our winter jackets, hats, and gloves. But the Polar Graph template has nothing to do with cold weather, and more to do with simplifying complex circular data and displaying it on the paper. The polar graph paper template is useful for visually representing circular motion, using polar coordinates. This template contains a worksheet with blank graph and another worksheet with a ready-to-use table, which allows you to enter your values and instantly plot them on polar graph in Excel.
Polar Coordinates Grapher
Here is a list of worksheets included in this template.
Blank Graph
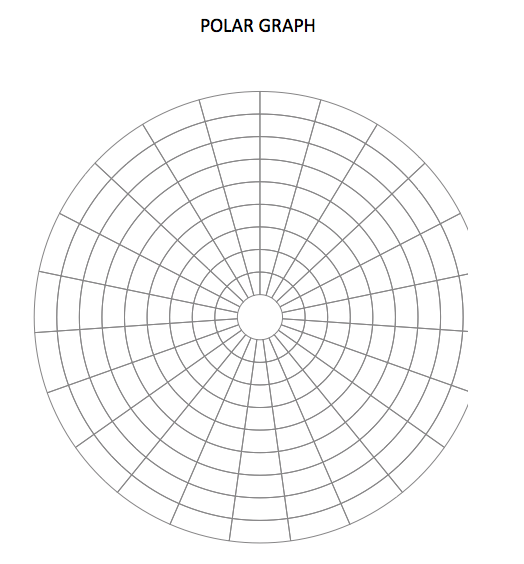
A blank polar graph in portrait, ideally use as a printout for plotting by hand.
(Graph) With Values
An automated graph in landscape orientation. This worksheet allows you to enter circular coordinate data – R (radius) and θ (theta, angle), in rows A and B, which are then use to instantly calculate degrees, using the “SIN” and “COS” function, to be plotted on a polar graph.
Desmos Polar Graph
Personalize and Print graph
Add personal touch! Each worksheet has a built-in header. Use the header to include information, such as name, title, and date.
Graphing Polar Coordinates
Polar coordinates are represented as (r,θ) where –
R = Radius (or distance).
Θ = Theta, which represents angle.
To graph coordinates, make table with distance (r) and angles (θ) values.
Polar Blank Graph Paper
The blank graph template is ideal for printing and plotting by hand, but working in Excel is also a good option. You can work the mathematics on a separate worksheet and plot the coordinates by inserting plot points and curved lines.
Excel Graph with Values
The Excel graph worksheet can do graphing for you, as long as you know the coordinates you are trying to plot. Enter the “R” and “Theta” values (columns A and B) and the rest happens automatically – calculations are applied using the SIN and COS functions to determine degrees, and plot the coordinates on the polar graph.
Note: do not enter values in columns C and D; these columns are automatic calculations
Customize
Add Some Color to Polar Graph
Background graph paper color can be jazzed up just the way you like it. To modify graph paper background, right-click on “Chart Area” (outside of the grid lines) and select “Fill” to pick a new color.
Titles of Polar Graph
In addition to changing color of your chart, you may also want to add “Chart Title”, as well as title the axes.
Displaying Data Points in Paper
In addition to circular visual representation, some people crave numbers! You can choose to display coordinates directly on the graph for numeric presentation purposes.
To display data points on graph, click on the circular plot results inside the graph. Next, go to the “Design” menu, select “Add Chart Elements”, then “Data Labels”, and finally select desired placement of the data points.

