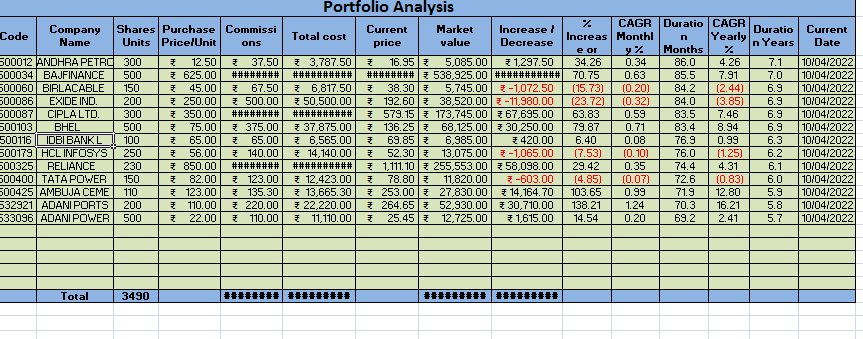
Portfolio Analysis is the examination of securities over a period of time to get an overview of investments is called Portfolio Analysis.
Thus, Portfolio analysis evaluations at regular intervals will help the investor make portfolio reallocation based on the performance or requirements of funds in the near future.
So, I have created the Microsoft Excel template for easy and accurate portfolio analysis and analyze appropriate analytical data of your invested securities.
Pre-requisite to Use Above Template
Furthermore proceeding to template contents and configuration part we need to download daily data from the BSE website in excel format. BSE Bhav Copy download option is available
Step 1: Select the required date and click submit or for today’s copy click the option on left for Equity (Current Date). So, Today copy is available only after market close. Therefore, Download the file and save it. It is a zip file containing the CSV format of Bhav Copy for that particular date. Extract the zip file and open it in MS Excel.
Step 2: Above all, Open the above template file along with a bhav-copy file downloaded from the BSE website. Then Go to bhav-copy and right-click on the sheet tab and select “Move or Copy”. Check the box “Create a copy” then select the template file from the drop-down menu and press Enter. This file will be copied to our template file.
This template works only with BSE (Bombay Stock Exchange) only.
Understanding the Template
Row 1 = A1 to O1 consists of headings for data input. For example, see the table below:
- A: Purchase date
- B: Code of Company (BSE/NSE) (optional)
- C: Company name
- D: Shares units Purchased
- E: Purchase price per unit
- F: Commissions to Agent if any
- G: Total cost of a particular purchase
- H: Current Market price per unit
- I: Current Market value
- J: Increase or decrease in investment
- K: Percentage increase or decrease of investments
- L: Monthly CAGR for investments
- M: Duration in months
- N: CAGR yearly for investments
- O: Duration in Years
- P: Current Date

