Download Probability Graph Paper Template In Excel

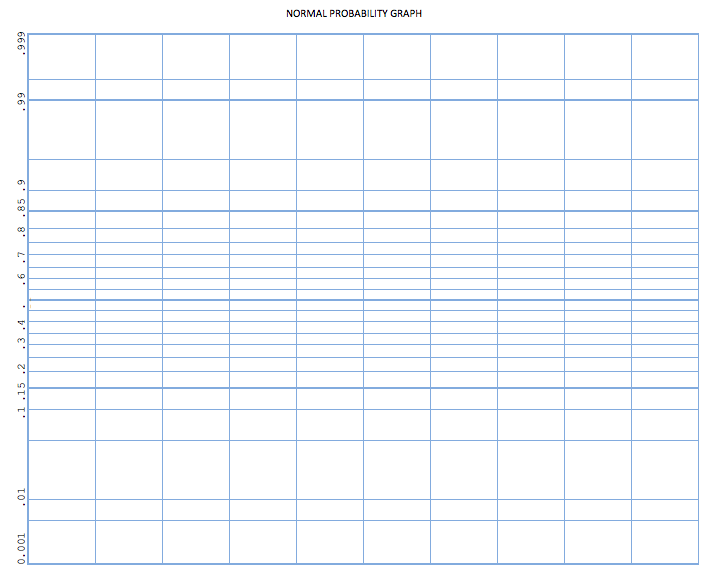
Not all types of probability graphs are used to predict probability. A “normal” probability plot is most useful for interpreting data, understanding patterns in data, and identifying data outliers by interpreting plotted distribution patterns. In a nutshell normal probability graph will help you answer whether your data follows the normal straight line distribution. In this template, we offer probability graph paper in portrait orientation and landscape orientation.

Probability Histogram Contents

Moreover, Here is a list of worksheets included in this template.

Probability Graph Portrait

So, This graph paper with labeled Y-axis, representing percent distribution of values, in portrait orientation.

Probability Graph Landscape

Hence, Probability graph paper with labeled Y-axis, representing percent distribution of values, in landscape orientation.

Binomial Distribution Graph Template

Personalize and Print

So, Add a personal touch! Each worksheet has a built-in header. Use header to include information, such as name, title, and date.

How to Calculate Percent Distribution on Probability Graph

In order to plot data points on probability graph paper we need to calculate percent distribution as it relates data sample.

Firstly, all values in your dataset should be sorted in ascending order – these values will be plotted along the X-axis. Next, calculate the percent distribution for each value using the formula below.

fi = (i-0.375)/(n+0.25)

Where,

i = the position of a value in dataset

n = total number of values in the dataset

Once the percent distributions are calculate, each value can plot versus the percentage of values in the dataset, in linear fashion.

Working in Excel probability chart

Plotting Data Points in Graph Paper

The probability graph template is ideal for printing and plotting by hand, but working in Excel is also an good option. You can organize your data points and percent distribution in table on a separate worksheet and plot the coordinates by inserting plot points in Excel.

To Insert plot points, go to “Insert” menu and select “Illustrations”, then select “Shapes”, and choose a plot point icon, such as a circle.

A Quick Excel Chart For Probability Graph

Moreover, If you’re tired of manually inserting points and dragging them onto the graph paper template, there is a quick and easy way to produce a normal probability plot.

To create a quick probability chart in Excel, organize your data (in ascending order) in any excel table. Next, highlight the dataset and select the “Insert” menu. Then, select the Scatter Chart (without lines) from the chart options to create a probability plot.

Thus, This is a quick way to answer the big question – “does my data follow a normal distribution?”

Add Some Color to Graph Paper

Background graph paper color can jazz up just the way you like it. To modify graph paper background, select area and use the “Fill Color” option, under the “Home” menu to charge the color of the grid.

Grid lines can also modify by using the “Border” tool to select a new “Line Color”.

X-axis Labels Probability

The Y-axis is pre-label with a percent distribution scale, but the X-axis can label to represent new, interesting data. To label the X-axis, manually enter a number scale along the bottom of the grid. Add an axis title by either inserting a textbox at the bottom or by typing a title directly into a cell.

Download this Probability Graph Paper template in Excel Format

Our easy to use editable Excel templates and save your significant amount of time and effort. Here’s how to download and use one of our templates:

  1. Download this free Excel Template: Once you’ve browsed through our collection of templates and find the one that best fits your needs. Once you’ve found the template you want, click on the download button.

  2. Replace sample data with your actual data: Once the template is downloaded, open it in Excel. You’ll see that it is already set up with sample data. To start analyzing your own data, simply replace the sample data with your actual data.

  3. Customize the template: Our templates are completely editable, which means you can customize them to fit your specific needs. For example, you can change the formatting, add or remove columns, or create new charts and graphs.

  4. Use the Excel template: Once you’ve fed in your data and customized the template, you’re ready to start using it for data analysis. Use the various tools and features of Excel to analyze and visualize your data, and make informed business decisions.

  5. Save and share: Once you’ve finished working on the template, save it to your computer and share it with other members of your team or stakeholders as needed.

Click Download Button To Get Probability Graph Paper Excel Template

Instruction :

All Excel templates and tools are sole property of xlsxtemplates.com. User can only download and use the excel templates for their Personal use only. All templates provided by XLSX templates are free and no payment is asked. However, you are not allowed to distribute or share in any other website for sole purpose of generating revenue from it.

 You can also download and use our 1000 Best PowerPoint Presentation Templates and 500 Resume Samples from PPTXTemplates.com  Completely Free. All our templates are designed by Professionals

Download Free Editable Excel Templates | Popular Templates

Product Supply Invoice

Product Supply Invoice

Product Supply Invoice Template: Your Essential Tool for Seamless Billing In the supply chain industry, accuracy and clarity in billing are crucial. With our Product

Read More »
NGO INGO Invoice Format

NGO INGO Invoice

NGO/INGO Invoice Format: Billing Simplified for Non-Profits In the humanitarian and non-profit sectors, transparency and accountability are paramount. Our NGO/INGO Invoice Template is crafted with

Read More »
Modern Commercial Invoice Template

Modern Commercial Invoice

Modern Commercial Invoice Template: Elevate Your Billing Aesthetics In the age of digitization and sleek design, why let your invoices stay behind? Our Modern Commercial

Read More »
Monthly Services Invoice Format

Monthly Services Invoice

Monthly Services Invoice Format: Your Billing Solution for Recurring Tasks Whether you’re offering subscription-based services, maintenance contracts, or any other monthly services, efficient billing is

Read More »
Manpower Supply Invoice Format

Manpower Supply Invoice

Manpower Supply Invoice Template: Streamlining Workforce Billing In the ever-competitive world of staffing and recruitment, efficient billing is a vital component of business operations. Our

Read More »
Management Services Invoice Format in Excel

Management Services Invoice

Management Services Invoice: Your Professional Path to Accurate Billing The business world today thrives on strategy, expertise, and precision. Management consultancies and advisory firms play

Read More »

Free editable professional Excel templates can be a useful tool for businesses, organizations, and individuals looking to streamline their data management and reporting processes. These templates can provide a pre-designed and pre-formatted framework for storing and organizing data, as well as for creating charts, graphs, and other visualizations to help communicate that data more effectively.

One advantage of using professional Excel templates is that they are often designed by experienced professionals who understand best practices for data management and visualization. This means that the templates are likely to be well-organized, easy to understand, and aesthetically pleasing, which can make working with them more efficient and enjoyable.

Another advantage is that these templates are often fully editable, allowing users to customize them to meet the specific needs of their organization or project. This can include adding or deleting rows and columns, changing the formatting and layout, and adding custom formulas and functions.

Some examples of professional Excel templates that may be available for free include budgeting templates for personal or business use, project management templates for tracking tasks and deadlines, and sales tracking templates for analyzing and forecasting sales data. There are also a wide variety of templates available for specific industries, such as real estate, marketing, human resource, Payroll management and among others.

Overall, free editable professional Excel templates can be a valuable resource for anyone looking to improve their data management and analysis skills. By providing a pre-designed and customizable framework for storing, organizing, and visualizing data, these templates can help users save time and make more informed decisions.