Download Sales Dashboard Template In Excel

Maximizing Sales Performance: Our Free Quarterly Sales Dashboard Template in Excel

Navigating the data-saturated business world can be a challenging task. To facilitate this, we’re excited to introduce our dynamic, user-friendly, and absolutely free Quarterly Sales Dashboard Template in Excel. This dashboard is designed with the unique needs of the sales and marketing team in mind, allowing for precise monitoring and evaluation of sales performance based on a range of key performance indicators (KPIs).

In this blog post, we will walk you through the distinctive features of this Excel dashboard, showcasing how it can transform your data management and decision-making processes.

The Magic Behind the Dashboard

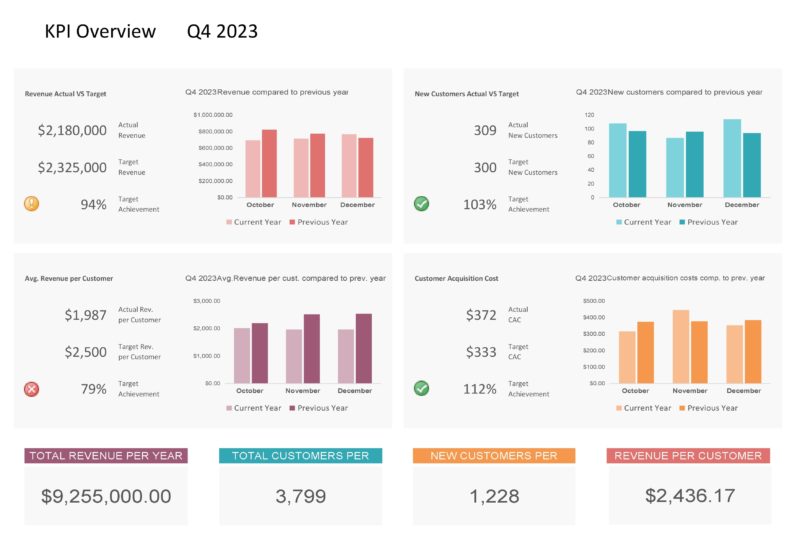
The power of our sales dashboard lies in its dynamism and simplicity. Just select the quarter from a dropdown menu, and voila! All your data visualization changes accordingly, presenting you with an overview of your sales performance for that quarter. This Excel template boasts robust data visualization capabilities, rivaling even Power BI reports. No advanced data analytics software is needed – it’s all in Excel!

Core Features of the Sales Dashboard

Customer Acquisition Details

One essential facet of any sales strategy is customer acquisition. Our dashboard provides an insightful view of your new customers, helping you understand who they are, where they’re coming from, and most importantly, the effectiveness of your acquisition strategies.

Revenue Growth Tracking

Revenue growth is a key indicator of business success. Our dashboard tracks your revenue growth over the selected quarter, giving you an instant picture of the health and growth of your business.

Target vs. Actual Revenue

Staying on top of your targets is crucial. This feature allows you to compare your revenue target against actual sales, thereby enabling a practical approach to your sales goals.

Average Revenue Per Customer

This KPI allows you to determine the average amount of revenue that each customer brings to your business. This insight can inform your pricing strategy and customer relationship management.

Customer Acquisition Cost Analysis

Understanding how much it costs to acquire a new customer can inform your marketing strategies and budget allocation. This feature provides a clear understanding of the cost-effectiveness of your customer acquisition strategies.

Yearly and Quarterly Trend Analysis

With the ability to view total revenue per year and the number of customers acquired in a year, you’ll gain a broader perspective on your business performance. Additionally, the quarterly trend analysis offers an in-depth view of your short-term sales trends.

How It Benefits Management, Sales, and Marketing Teams

Our dashboard’s visual nature and simple interface make it easy for the management team to interpret the data. It aids in making informed decisions, setting realistic targets, and monitoring the performance of the business against these targets.

For the sales team, the dashboard provides insights into their performance and potential areas for improvement. It empowers them to stay on track with targets and adjust their strategies where necessary.

Marketing teams benefit by gaining insights into customer acquisition costs and trends. This helps in refining marketing strategies and optimally allocating marketing resources.

In conclusion, our Quarterly Sales Dashboard in Excel is a free, dynamic, and powerful tool that can help your business transform data into actionable insights. It not only simplifies data management and interpretation but also promotes data-driven decision making across your sales and marketing teams. Download it today and experience the revolution in sales data management!

Download this Sales Dashboard template in Excel Format

Our easy to use editable Excel templates and save your significant amount of time and effort. Here’s how to download and use one of our templates:

  1. Download this free Excel Template: Once you’ve browsed through our collection of templates and find the one that best fits your needs. Once you’ve found the template you want, click on the download button.

  2. Replace sample data with your actual data: Once the template is downloaded, open it in Excel. You’ll see that it is already set up with sample data. To start analyzing your own data, simply replace the sample data with your actual data.

  3. Customize the template: Our templates are completely editable, which means you can customize them to fit your specific needs. For example, you can change the formatting, add or remove columns, or create new charts and graphs.

  4. Use the Excel template: Once you’ve fed in your data and customized the template, you’re ready to start using it for data analysis. Use the various tools and features of Excel to analyze and visualize your data, and make informed business decisions.

  5. Save and share: Once you’ve finished working on the template, save it to your computer and share it with other members of your team or stakeholders as needed.

Click Download Button To Get Sales Dashboard Excel Template

Instruction :

All Excel templates and tools are sole property of xlsxtemplates.com. User can only download and use the excel templates for their Personal use only. All templates provided by XLSX templates are free and no payment is asked. However, you are not allowed to distribute or share in any other website for sole purpose of generating revenue from it.

 You can also download and use our 1000 Best PowerPoint Presentation Templates and 500 Resume Samples from PPTXTemplates.com  Completely Free. All our templates are designed by Professionals

Download Free Editable Excel Templates | Popular Templates

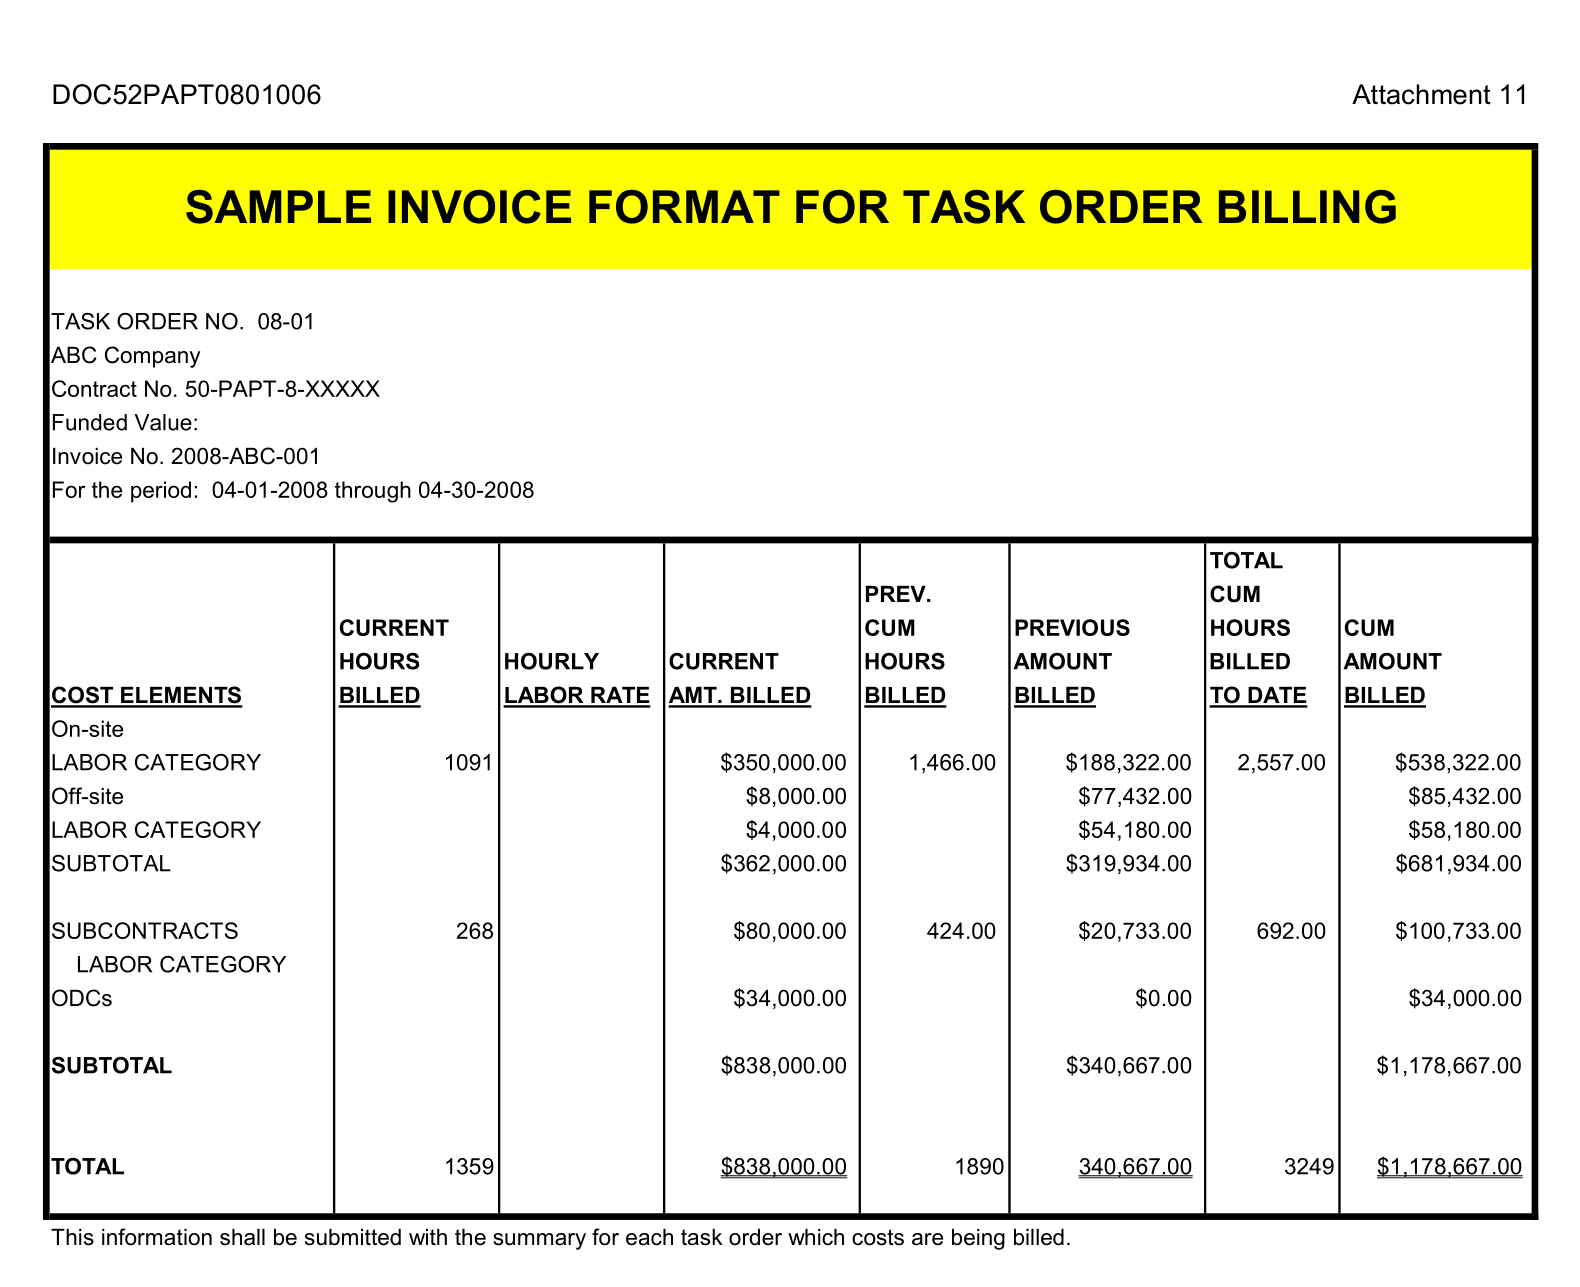
Task Order Billing Format

Task Order Billing Format

Task Order Billing Format Template: Your Key to Efficient Milestone-Based Invoicing In a landscape where project dynamics shift and evolve, billing clients based on project

Read More »
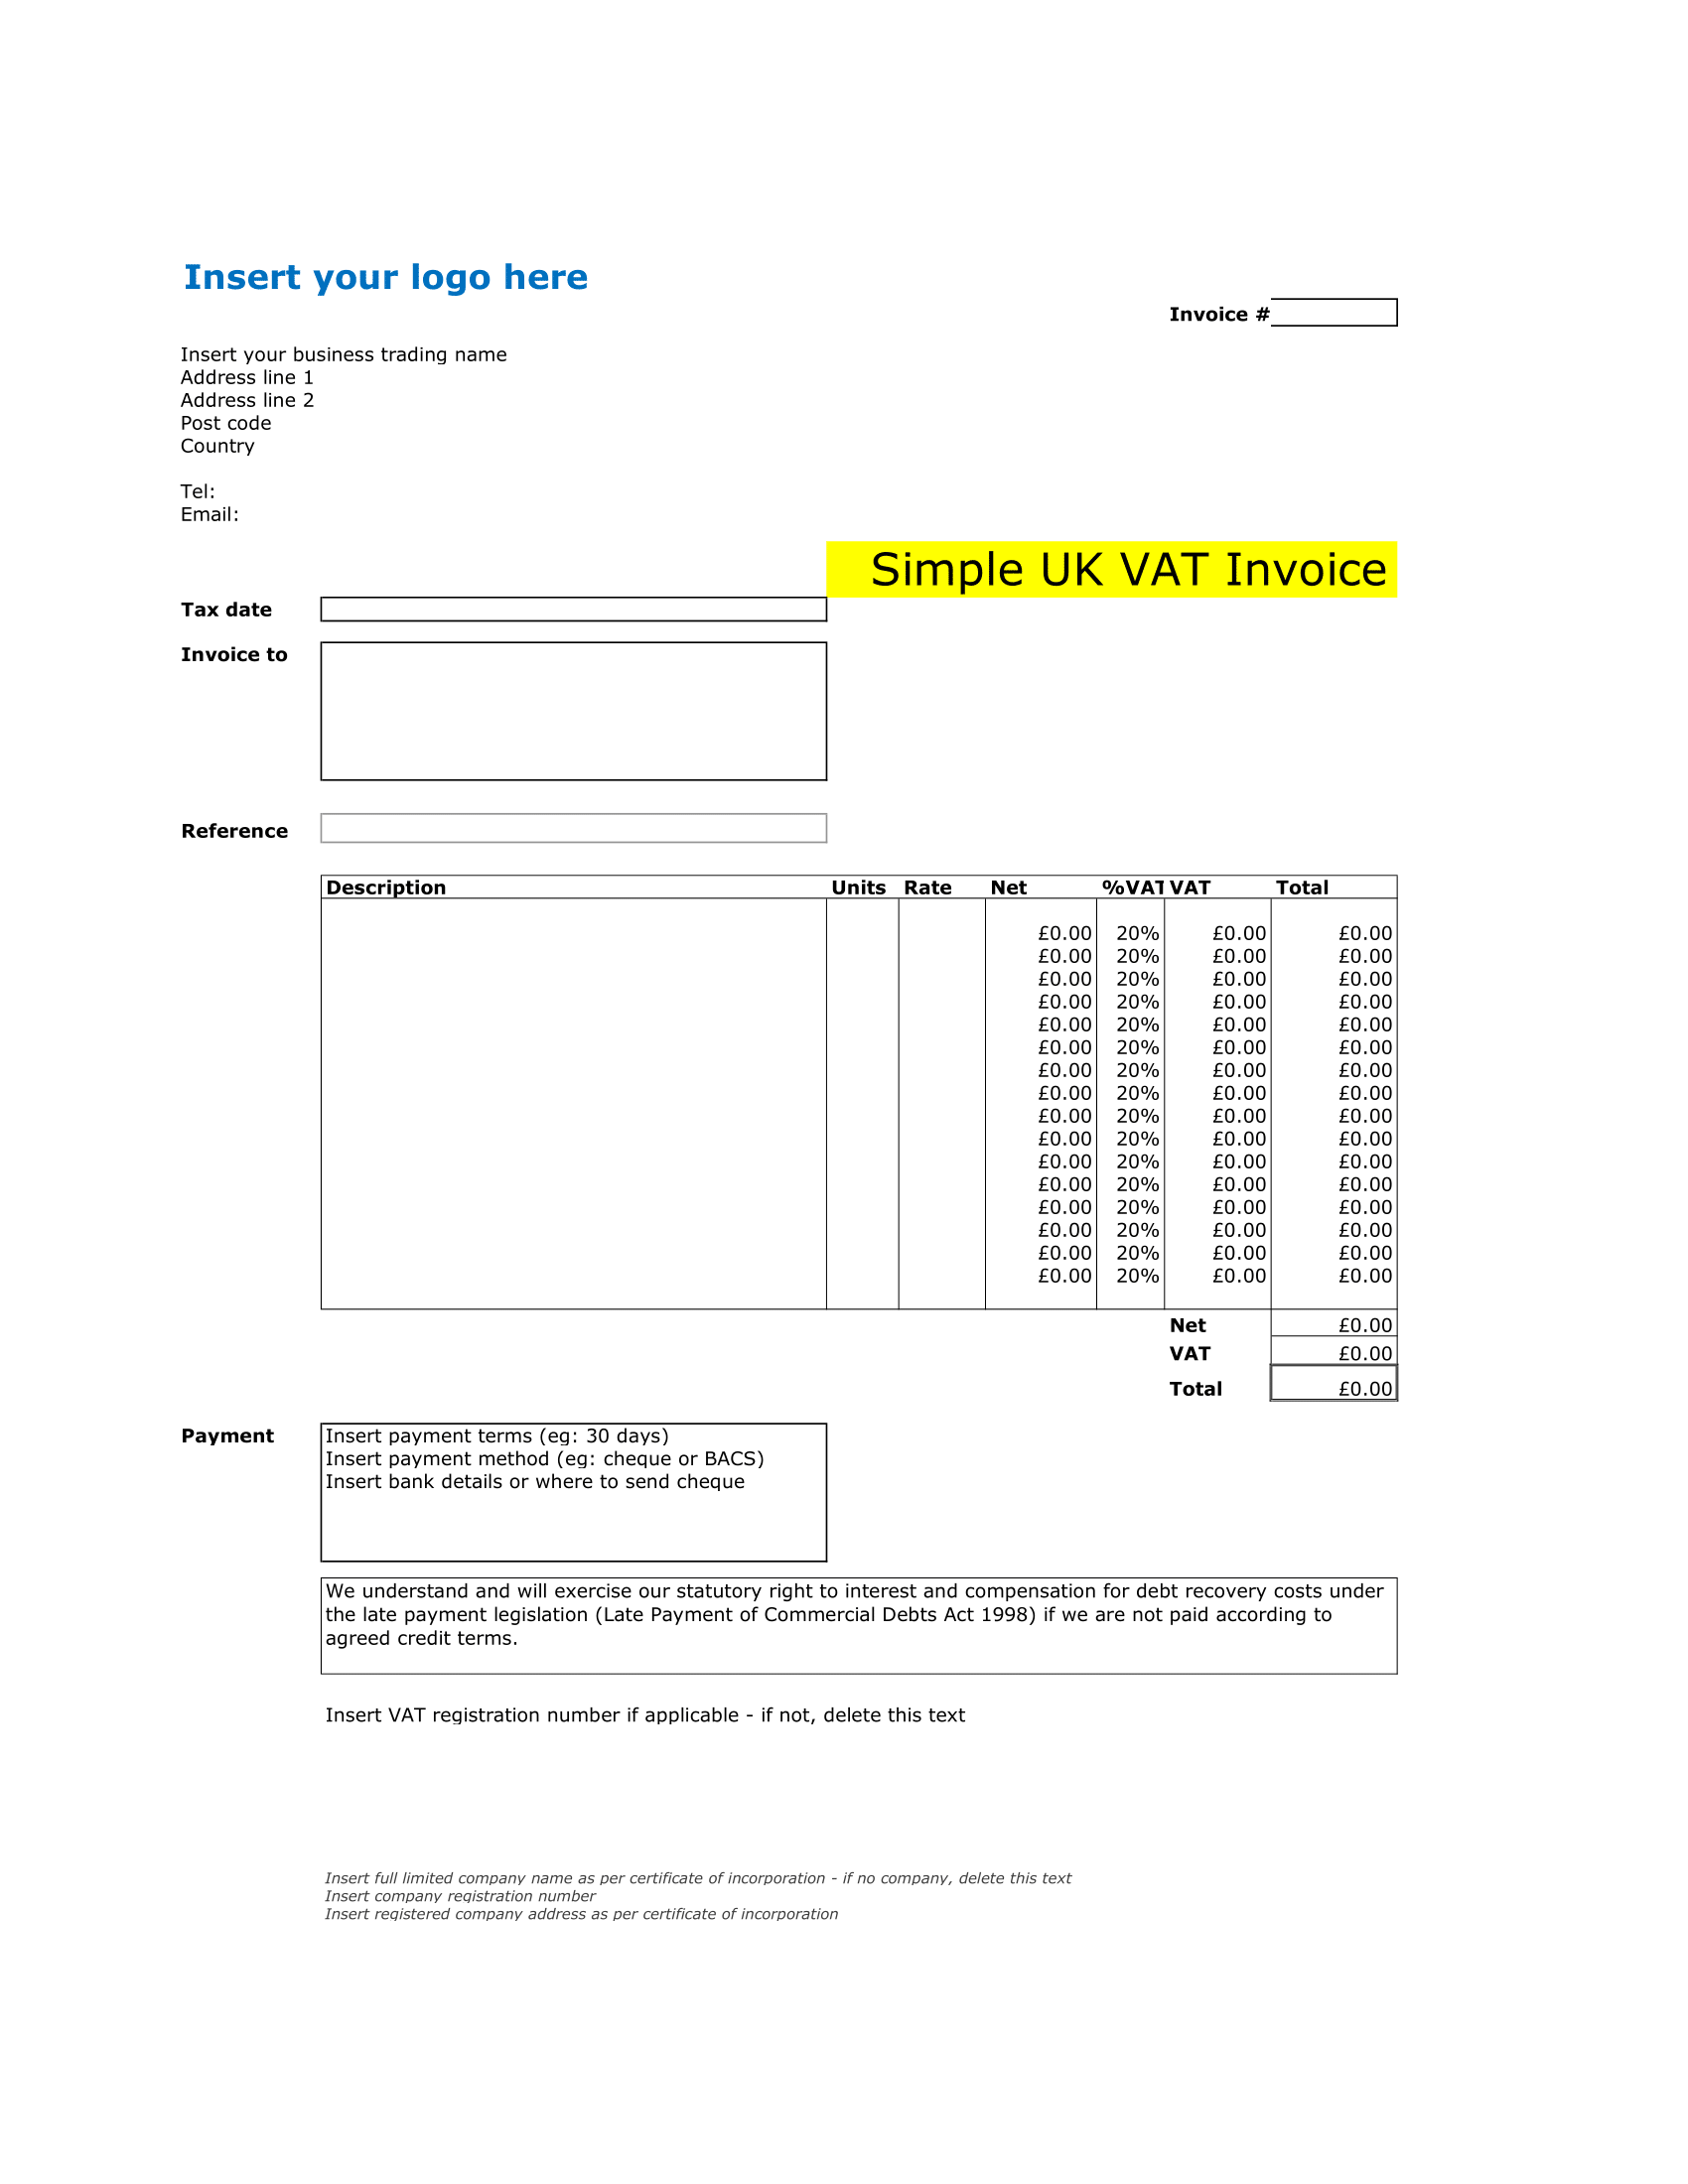
Simple Tax Invoice

Simple Tax Invoice

In the realm of business, clarity, precision, and simplicity can be the key to smooth transactions. A Simple Tax Invoice Template is designed to cater

Read More »

Free editable professional Excel templates can be a useful tool for businesses, organizations, and individuals looking to streamline their data management and reporting processes. These templates can provide a pre-designed and pre-formatted framework for storing and organizing data, as well as for creating charts, graphs, and other visualizations to help communicate that data more effectively.

One advantage of using professional Excel templates is that they are often designed by experienced professionals who understand best practices for data management and visualization. This means that the templates are likely to be well-organized, easy to understand, and aesthetically pleasing, which can make working with them more efficient and enjoyable.

Another advantage is that these templates are often fully editable, allowing users to customize them to meet the specific needs of their organization or project. This can include adding or deleting rows and columns, changing the formatting and layout, and adding custom formulas and functions.

Some examples of professional Excel templates that may be available for free include budgeting templates for personal or business use, project management templates for tracking tasks and deadlines, and sales tracking templates for analyzing and forecasting sales data. There are also a wide variety of templates available for specific industries, such as real estate, marketing, human resource, Payroll management and among others.

Overall, free editable professional Excel templates can be a valuable resource for anyone looking to improve their data management and analysis skills. By providing a pre-designed and customizable framework for storing, organizing, and visualizing data, these templates can help users save time and make more informed decisions.