How to Create Revenue Trend Chart in Excel
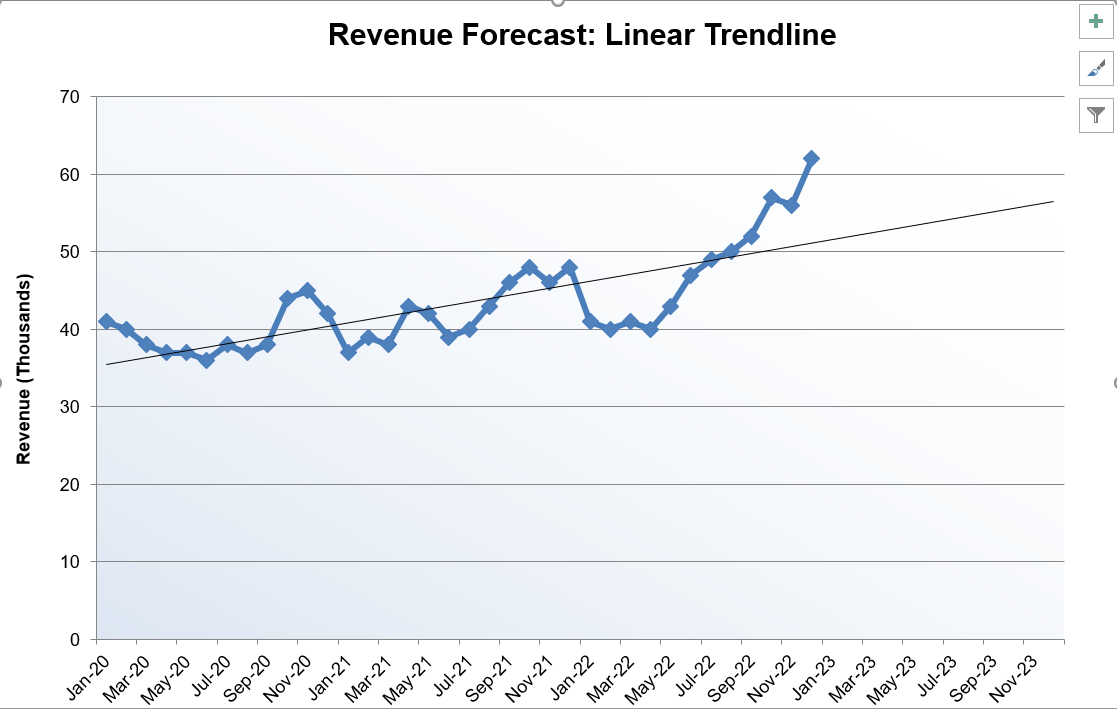
A Revenue Trend Chart is a useful tool for tracking the growth of a company’s revenue over a period of time. It can be created using an editable Excel template, which allows you to input your baseline sales data and generate graphs with different trendlines, such as linear, power, and exponential.
To create a Revenue Trend Chart in Excel, you will need to understand the concept of variable values. The Y-value is the range or array of y values from the line equation for the Monthly Basis, while the X-value is the range or array of x values from the line equation. If the x value is null, Excel will assume the x-values as 10, 20, 30, etc. with the opposite of values as y.
Excel’s TREND function can be used to calculate the next month’s sales based on the historical data provided. The function uses the least-squares method to find the line of best fit, and the chart format allows for easy visualization of the data.
Revenue growth is important for a company as it can lead to increased sales, expansion of products and services, new opportunities, profitability, and benefits in valuation. Additionally, a company with a strong revenue growth chart can attract more customers.
There are several strategies that can be used to drive revenue growth, such as content marketing, email marketing, and offering premium versions of products. By tracking and analyzing revenue trends, managers and investors can make informed decisions about the financial growth of an organization.
Download Free Revenue Trend Chart Excel Template:
This free, editable Excel template is designed to help you analyze and track your company’s revenue over time. The template includes a line chart that displays revenue trends, as well as a table that shows the actual revenue numbers.
To download the template, simply click on the link provided. Once the template is open in Excel, you can enter your own data and customize the chart to fit your needs.
The template is easy to use and requires no prior knowledge of Excel. Simply enter your revenue data into the table, and the chart will automatically update to reflect the changes. You can also customize the chart’s appearance by changing the colors, font, and other formatting options.
The template is a great tool for business owners, managers, and financial analysts who need to track and analyze their company’s revenue. It can also be used by students or researchers who are studying business or finance.
Useful features of the template include:
- Automatically updates chart based on data input
- Customizable chart formatting options
- Easy to use and understand
- Can be used for multiple years data
- Can be used to compare revenues of different departments/business units/product lines
You can download the excel template by clicking on this link: [Insert link to template]. This template is completely free and can be used for both personal and commercial use.
In conclusion, the Revenue Trend Chart Excel Template is a great tool for tracking and analyzing your company’s revenue over time. It is easy to use, customizable, and completely free. Download it now to start tracking your revenue trends and making data-driven decisions.

