Sales Performance Evaluation Template in Excel Sheet: A Dynamic Tool to Track Sales Performance
With sales being the lifeblood of any business, it’s crucial to keep track of your sales team’s performance. A diligent assessment allows you to recognize star performers, identify areas of improvement, and plan subsequent strategies more effectively. Excel spreadsheets have long been the backbone of such data management and analysis. That’s where the Sales Performance Evaluation Template, a dynamic and automated Excel tool, comes into play.
Our Sales Performance Evaluation Template allows you to measure the performance of your sales team on a monthly, quarterly, half-yearly, or yearly basis. It’s a simple yet comprehensive tool, requiring you to enter the sales figures for each sales executive. The template takes care of the rest – evaluating sales performance in percentages and ranking each employee according to their output. It is designed to help maintain motivation and discipline within the team, while also helping identify low performers, leading to a more systematic training and development plan.
What’s Inside the Sales Performance Evaluation Excel Template?
This user-friendly template comprises two sheets: the Sales Performance Evaluation Sheet and the Quarterly Charts Sheet.
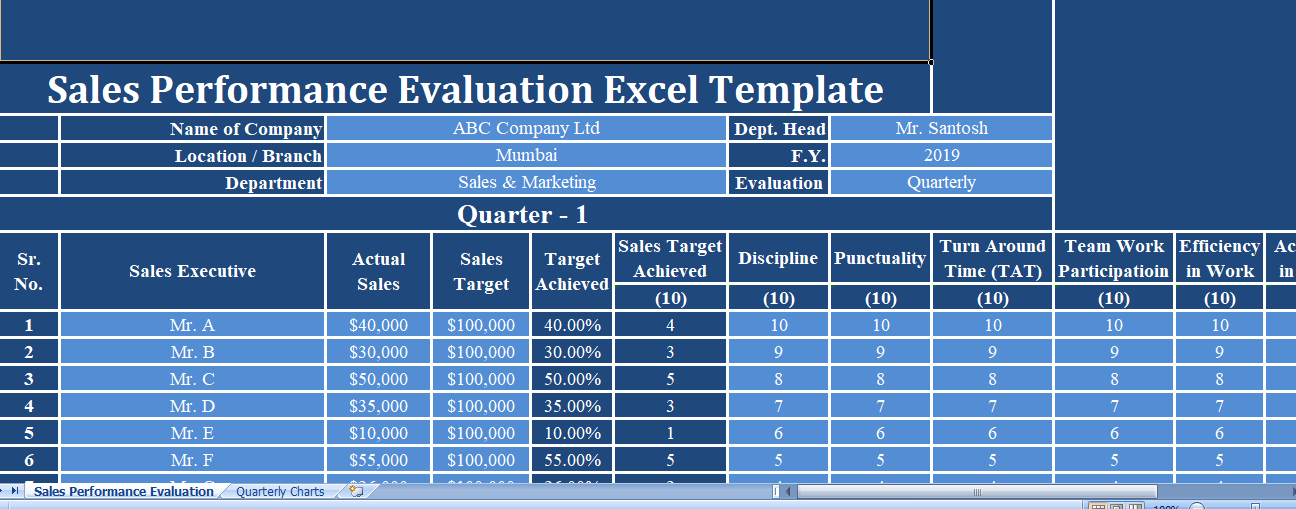
Sales Performance Evaluation Sheet
In this section, you need to input the sales figures of individual sales executives against their targets, along with points allocated for various performance attributes.
The Sales Performance Evaluation Sheet has two subsections: the Sales Data Section and the Evaluation Section.
Sales Data Section
This part includes:
- Sr. No: Serial number
- Sales Executive: Name of sales executive/team member.
- Actual Sales: The sales made by the respective salesperson in dollar terms during the specified period.
- Sales Target: Target issued by the team leader to each salesperson.
- Target Achieved: Target achievement in percentage terms.
Evaluation Section
This segment includes ten attributes for evaluation, with points ranging from 1 to 10 (10 being the most satisfactory). The attributes include:
- Sales Target Achieved: This is auto-calculated based on the target achieved percentage. For every 10 percent, there is one point. So, 100% or above gets 10 points, 90-99 gets 9 points, and so on.
- Discipline
- Punctuality
- Turn Around Time (TAT)
- Team Work Participation
- Work Efficiency
- Work Accuracy
- Constructive Initiatives
- Interpersonal Abilities
- Time Management
The grand total column sums up all the points, and the rank column then displays the ranks based on each sales rep’s grand total.
Quarterly Charts
This section displays graphical representations of your sales team’s performance each quarter, providing a visual insight into your team’s progress.
How Can This Template Benefit You?
This free-to-use Excel template is a game-changer for sales managers, team leaders, and small to medium business owners. It not only provides an overview of the sales team’s performance but also acts as a performance appraisal tool for each sales representative. The automated calculations and rankings save time, reduce errors, and offer actionable insights to aid your decision-making process.
Moreover, by revealing the strengths and weaknesses of your team, this template allows for more focused coaching and training initiatives. With the help of this tool, you can truly leverage the power of data to drive your team’s performance and, ultimately, the success of your business. So why wait? Start using our Sales Performance Evaluation Template today to monitor and enhance your sales team’s productivity.
Taking Full Advantage of the Sales Performance Evaluation Template
The effectiveness of our Sales Performance Evaluation Template is not just in its automation, but also in its flexibility and adaptability. Designed to cater to the dynamic nature of sales and lead generation, the template allows for customization to match the unique needs of your business or sales team. Here’s how you can make the most of it:
1. Flexibility in Time Frame
The template caters to different time frames of evaluation. Although it is set up on a quarterly basis (in line with standard industry practice), you can adjust it to monthly, half-yearly, or yearly evaluations. The adjustment is simple – just copy the format and modify the headings as per your needs.
2. Comprehensive Evaluation Metrics
The template uses a wide range of performance metrics for evaluation, thereby offering a holistic picture of your sales team’s performance. You can assess not only the sales target achievements but also crucial factors like discipline, punctuality, teamwork participation, work efficiency, accuracy, constructive initiatives, interpersonal abilities, and time management. This comprehensive approach ensures that you are not just tracking numbers but also the qualitative aspects that lead to those numbers.
3. Visual Representation for Clear Understanding
The Quarterly Charts provide a graphical representation of your sales team’s performance, making the data easier to digest. Visualizations help you quickly spot trends, patterns, and outliers, and take appropriate actions.
Implementing the Sales Performance Evaluation Template
Implementing this template is as easy as downloading it and starting to fill in your data. The pre-defined formulas take care of all the calculations for you. All you need to do is input the sales, targets, and points as per each sales executive’s performance, and the template will automatically prepare the report.
By providing a clear view of your sales team’s performance, the Sales Performance Evaluation Template equips you with the data-driven insights you need to guide your team to higher productivity and sales figures. It makes the evaluation process streamlined, efficient, and accurate, leaving no room for bias or ambiguity.
Conclusion
In the current competitive landscape, keeping track of your sales team’s performance is not just a requirement – it’s a necessity for survival and growth. And with our Sales Performance Evaluation Template, you get a free, flexible, and robust tool to do just that. So don’t miss out on this opportunity to get a grip on your sales team’s productivity and pave the way for more informed decision-making. Implement this template today, and start steering your sales team towards greater success.