Consolidated Sales Analysis Report is a ready-to-use excel template to maintain records of your sales team and generate multiple annual sales reports with charts.
Managing data of a sales team is very crucial in marketing. It helps in paying incentives to sales executives and provides a detailed overview of their performance.
The product report helps management to see the performance of the product line and further helps to take important decisions in order to increase sales.
This Consolidated sales analysis report generates product-wise, executive-wise, region-wise and also city-wise monthly and annual reports of sales.
Sales Analysis Report Excel Template
We have created a simple Consolidated Annual Sales Report Excel Template to record and analyze sales data for a complete year.
In addition to this, it also consists of detail reports with a graphical representation that is helpful for the management to take important decisions.
Contents of Sales Data Analysis Template
This template consists of 14 sheets:
- Master Sheet.
- Sales Report (April to March).
- Consolidated Annual Report.
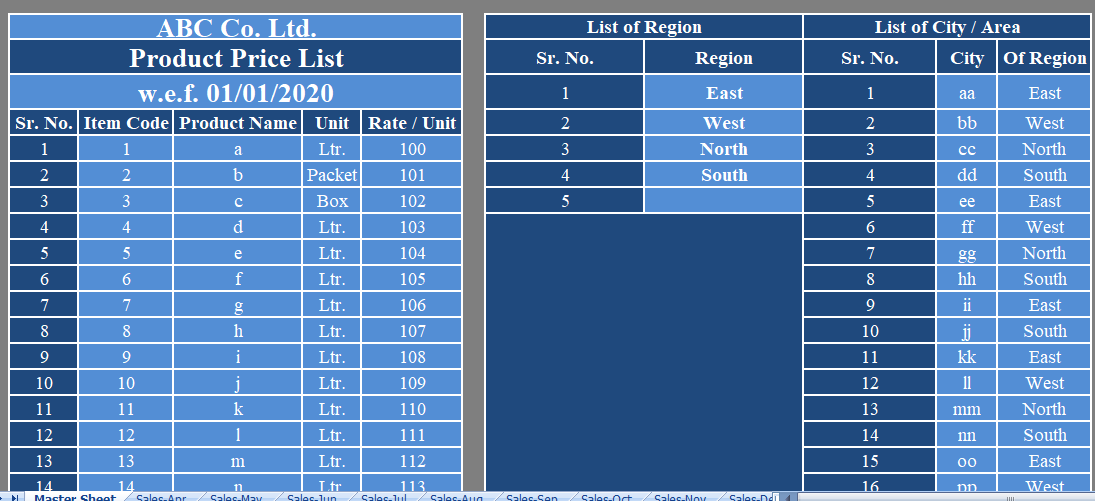
Master Sheet
The Master Sheet consists of data like Product List, Region List, City List, and Sales Executive List.
Monthly Sales Report (12 Sheets)
The monthly sales report fetch the company name from the previous sheet as soon as you enter first date. It will automatically fetch month and year using the TEXT Function.
Annual Sales Report
Therefore, This sheet doesn’t require any data entry as it fetches month-wise data from 12 sheets.
Annual Sales data analysis Report sheet consists of the following reports:
- Sales Summary With Graph
- Month-wise Executive-wise Annual Sales Summary With Graph
- Individual Executive Annual Sales Report With Graph
- Product-wise Annual Sales Report with Graph
- Individual Product Annual Unit Sales Report with Graph
Also select name of the executive from the dropdown list. The system will automatically fetch respective data and prepare the graph for the same.
Moreover, Select name of product from the dropdown list. The system will automatically fetch respective data and also prepare graph for the same of Sales trend analysis.
Therefore, Just have to select the name of the region from the dropdown list. The system will automatically fetch respective data and also prepare the graph for the same.
Thus, Select name of the city from the dropdown list. The system will automatically fetch respective data and also prepare the graph for the same.
Moreover, this template can serve you as an all-in-one template for sales team. You can generate multiple of MIS reports from this template that sales managers, sales executives, and Management can use for in-depth analysis.

