The Coordinate Graph Paper Template is type of cartesian graph paper template, which is very useful because it allows you to draw straight lines and other objects, with precision and ease. This template contains multiple worksheet. Each worksheet contains .25 inch scale grid with axis and labels. You may choose to work with 4-quadrant axis or single axis grid, in either portrait or landscape orientation.
Coordinate Plane
Here is a list of all worksheet included in this template.
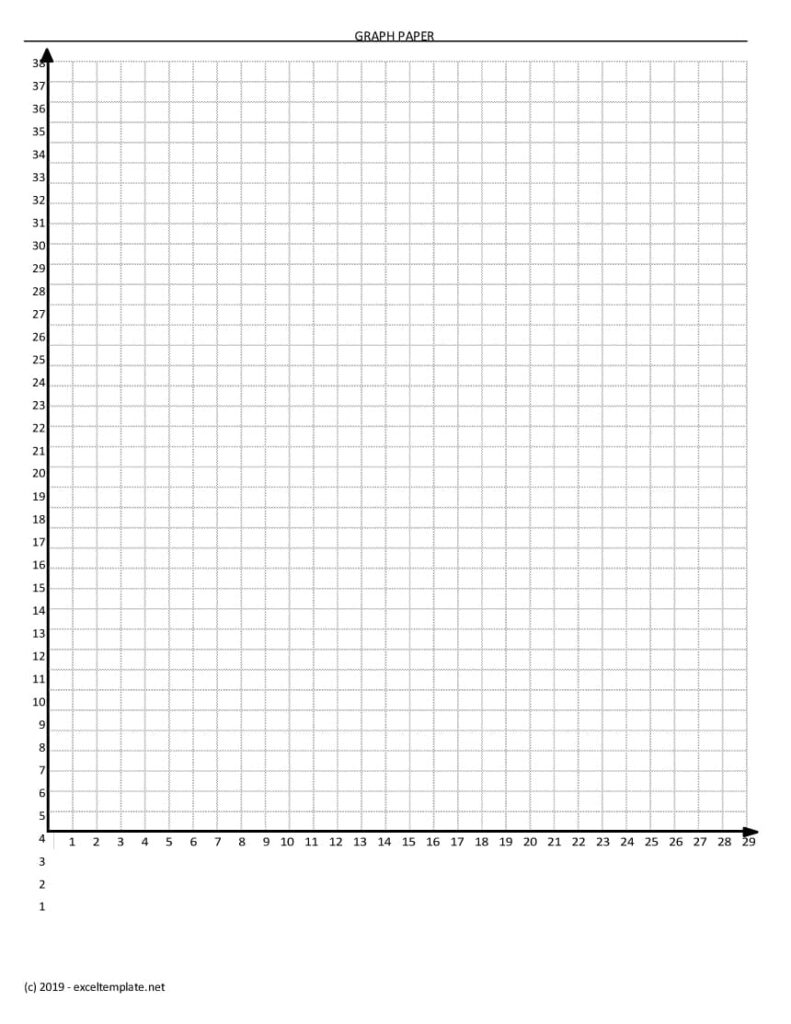
.25 Inch Portrait Graph paper
Coordinate Graph paper at .25 inch scale, 4-quadrant axis, and numeric labels in increments of +1 and -1. This grid is in portrait orientation. Ideal for equation and coordinates with positive and negative values.
.25 Inch Landscape Graph paper
Graph paper at .25 inch scale, 4-quadrant axis, and numeric labels in increments of +1 and -1. This grid is in landscape orientation (for larger X-axis values). Ideal for equations & coordinates with positive and negative values.
Single Axis .25 Inch Portrait
Graph paper at .25 inch scale, single axis, and numeric labels in increments of +1. This grid is in portrait orientation (for larger Y-axis value). Ideal for equations and coordinates with larger positive value.
Single Axis .25 Inch Landscape
Graph paper at .25 inch scale, single axis, and numeric labels in increment of +1. This grid is in landscape orientation. Ideal for equation and coordinates with larger positive values
Quadrants on a Graph
Make it your own-personalize! Each worksheet has built-in header. Use header to include information, such as name and date.
If these configurations are exactly what you’re looking for and you want to draw by hand, just hit print – each tab is configure to print in its appropriate orientation type.
Coordinate Plane Graph
Create Basic Charts
You may also choose to work with graph paper in Excel. For example, linear objects can insert to help with plots and drawings. To use linear objects, select “Illustrations”, and then select “Shapes”, under the “Insert” menu. This gives you option to include a line or a shape with greater precision by using the graph.

