Download Gantt Chart Template In Excel

Gantt chart is a tool for project management developed originally by Henry Gantt in the early 1900s. It is a type of bar chart that shows the start and end times for each task in a project schedule. The tasks are using a work breakdown structure with summary tasks for the main project deliverables and sub-tasks that break the project down into a detailed and manageable task hierarchy.

Simple Gantt Chart Template

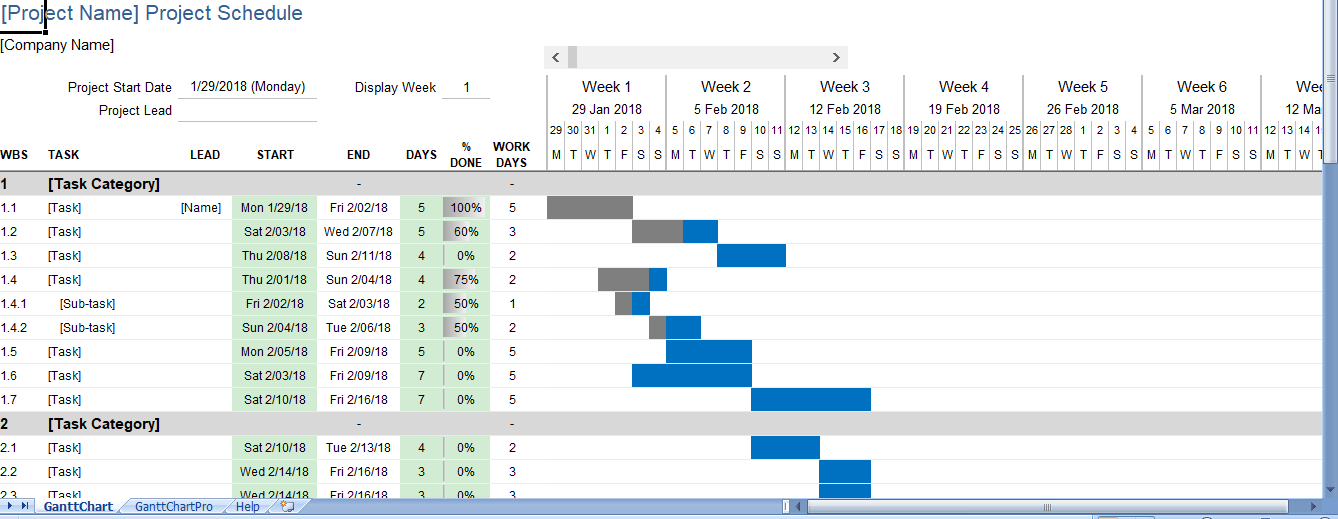
This template contains the core functionality needed to create a simple Gantt chart easily. Each row of the worksheet represents a separate task. All you need to do is define the start date and duration of each task.

  • To add more tasks, you just copy and paste rows (or insert a row then press Ctrl+D to copy formulas down).
  • Certainly to change the range of dates displayed in the chart area, just slide the scroll bar.
  • To track the status of a task, edit the % Complete column. The bars in the chart show the % complete for each task.
  • The vertical red line shows the current date.
  • To use the automatic work breakdown structure numbering, copy the formula for the appropriate level from the bottom of the worksheet.

Creating Dependent Tasks in a Gantt Chart with Excel

One of the reasons why Excel is a useful tool for creating Gantt Charts is that task dependencies can be define by using Excel formulas. Gantt Chart Template Pro is designe to make this easier than entering your own formulas, but here are a few simple examples you can try:

1. Start a Task the Day After a Predecessor Task

=end_date + 1

where end_date is a reference to cell (e.g. D10) containing the END date of the predecessor task.

2. Start a Task on the Same Day as another task

=start_date

where start_date is a reference to cell containing the START date of the other task.

3. Start a Task the next WORK day after a Predecessor task (excludes Sat & Sun)

=WORKDAY(end_date,1)

Use the WORKDAY.INTL() function in Excel 2010+ to define a custom work week (days other than only Sat & Sun)

The problem with only using formulas is that you can’t see the dependencies between tasks when you view or print the chart. Other Gantt chart software may show dependencies as lines connecting the bars in the gantt chart, but I’ve never found a simple way for Excel to do that (and the lines can get really messy).

Microsoft planner Gantt chart

The simple approach is to list the WBS number of the Predecessor in another column, like in the critical path example above. In the CPM template and in Gantt Chart Template Pro, formulas calculate the start dates based on what you enter. If you want to try doing this on your own, here is a formula to get you started:

4. Start a Task the next day after a Predecessor task

Showing Critical Tasks in a Gantt Chart

Some Gantt charts are design to show the critical path and available slack or float time for each task. If every task must be done in sequence, every task is critical and there is no slack time (because if one task is delayed, it delays the entire project). However, if some tasks can be done in parallel and have some available slack time, then the project manager may be able to free up some resources to devote to the more critical tasks.

The CPM algorithm requires a fully defined task dependency structure, meaning that every task must have a successor. A simple Gantt chart may not need to have the dependencies between tasks fully defined, which is why you will see many project schedules with tasks defined only with a start and end date.

Download this Gantt Chart template in Excel Format

Our easy to use editable Excel templates and save your significant amount of time and effort. Here’s how to download and use one of our templates:

  1. Download this free Excel Template: Once you’ve browsed through our collection of templates and find the one that best fits your needs. Once you’ve found the template you want, click on the download button.

  2. Replace sample data with your actual data: Once the template is downloaded, open it in Excel. You’ll see that it is already set up with sample data. To start analyzing your own data, simply replace the sample data with your actual data.

  3. Customize the template: Our templates are completely editable, which means you can customize them to fit your specific needs. For example, you can change the formatting, add or remove columns, or create new charts and graphs.

  4. Use the Excel template: Once you’ve fed in your data and customized the template, you’re ready to start using it for data analysis. Use the various tools and features of Excel to analyze and visualize your data, and make informed business decisions.

  5. Save and share: Once you’ve finished working on the template, save it to your computer and share it with other members of your team or stakeholders as needed.

Click Download Button To Get Gantt Chart Excel Template

Instruction :

All Excel templates and tools are sole property of xlsxtemplates.com. User can only download and use the excel templates for their Personal use only. All templates provided by XLSX templates are free and no payment is asked. However, you are not allowed to distribute or share in any other website for sole purpose of generating revenue from it.

 You can also download and use our 1000 Best PowerPoint Presentation Templates and 500 Resume Samples from PPTXTemplates.com  Completely Free. All our templates are designed by Professionals

Download Free Editable Excel Templates | Popular Templates

Sales Invoice With Tracker

Sales Invoice With Tracker

In today’s fast-paced business world, sales invoices aren’t just about demanding payment. They’re part of an integrated system that can help businesses track sales, manage

Read More »
Project Wise Invoice Format in Excel

Project Wise Invoice Format

Project Wise Invoice Format: Your Comprehensive Tool for Accurate Project Billing Projects, especially in industries like construction, IT, or consulting, can often span months or

Read More »
Proforma Invoice

Proforma Invoice

Proforma Invoice Template: Streamlining Your Pre-Transaction Communications While many businesses are familiar with standard invoices, the realm of proforma invoices, serving as a precursor to

Read More »
Professional Service Invoice

Professional Service Invoice

Professional Service Invoice: Tailored for Expert Service Providers The realm of professional services is vast, encompassing consultants, advisors, trainers, and many others. What ties all

Read More »

Free editable professional Excel templates can be a useful tool for businesses, organizations, and individuals looking to streamline their data management and reporting processes. These templates can provide a pre-designed and pre-formatted framework for storing and organizing data, as well as for creating charts, graphs, and other visualizations to help communicate that data more effectively.

One advantage of using professional Excel templates is that they are often designed by experienced professionals who understand best practices for data management and visualization. This means that the templates are likely to be well-organized, easy to understand, and aesthetically pleasing, which can make working with them more efficient and enjoyable.

Another advantage is that these templates are often fully editable, allowing users to customize them to meet the specific needs of their organization or project. This can include adding or deleting rows and columns, changing the formatting and layout, and adding custom formulas and functions.

Some examples of professional Excel templates that may be available for free include budgeting templates for personal or business use, project management templates for tracking tasks and deadlines, and sales tracking templates for analyzing and forecasting sales data. There are also a wide variety of templates available for specific industries, such as real estate, marketing, human resource, Payroll management and among others.

Overall, free editable professional Excel templates can be a valuable resource for anyone looking to improve their data management and analysis skills. By providing a pre-designed and customizable framework for storing, organizing, and visualizing data, these templates can help users save time and make more informed decisions.