When you begin planning for your next project, how prepared will you be? You may purchase software to help you build a project plan, assemble team ready for their task assignments, and compose a communication schedule for your stakeholders. And while all these things are important, perhaps the most important piece you should have ready is a Gantt chart Planner.
Microsoft Planner Gantt
A Gantt chart is (usually) a horizontal bar chart that visually represents a schedule. Activities are link by, for just one example, their dependencies on shared resources or personnel. For project managers, Gantt charts make it easy to track individual pieces of project’s progress, to share that information with a team, and to see how a surprise on one task of a larger job will impact the project as a whole.
Gantt Chart in Planner
With this free Gantt chart planner you don’t have to worry about buying software to build a Gantt chart. As long as you use Microsoft Excel, this template pops right into the place and is ready for you to work your project management magic.
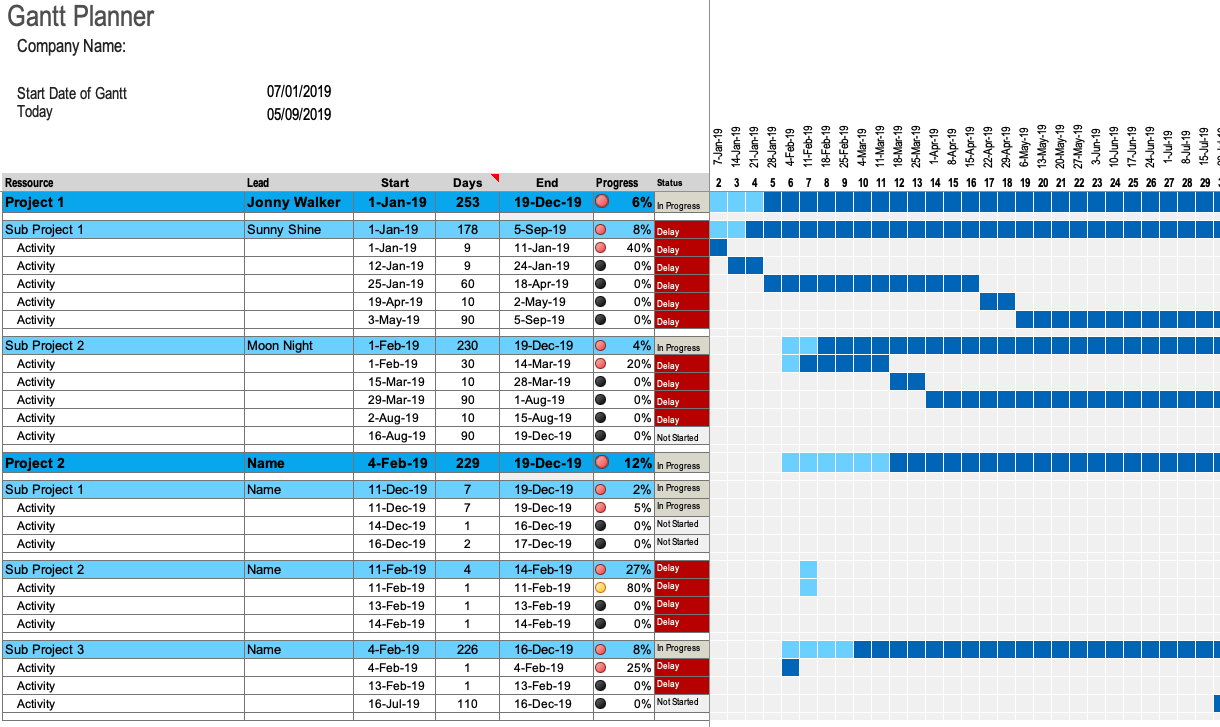
You have one large sheet to see both areas, including work breakdown structure section on the left, and bar chart view on the right. These two sections work hand-in-hand to give you a clean picture of your project’s progress from beginning to end.
Project Information
As we discuss, you’ll start by entering your project information first and then move onto the work breakdown section.
Work Breakdown Structure
After adding the project details, you’ll complete the work breakdown structure section directly. This area is formatted for you to include multiple projects and sub projects in one handy place.
Start and Days
Once you enter your projects, sub projects, and activities in the work breakdown section, you can add the Start dates and Days.
End Dates
Do not add End dates for any activity or project in the template. The End dates are calculated automatically based on Start dates and Days fields that you complete.
This is a wonderful feature of this Gantt chart template because you don’t have to manually calculate those end dates.
Progress
Like with Start and Days fields, you will only add Progress for each Activity. The Progress will be average and then populate automatically in the Project and Sub Project rows.
You can just enter simple number for the Progress of each task and the template will reformat it as a percentage. In addition to this, you’ll see convenient, colored indicators in the progress column.
Status
The Status column is another terrific and useful feature of this gantt chart template. Using the Start, Days, and Progress fields, the Status is automatically determined and populated for you. You can see, with quick glance, the current status of all tasks, sub projects, and projects in your Gantt chart.
The Chart View
Your project timeline appears in the Gantt chart view on the right. With details you enter in the work breakdown structure section, you get a nice view of your project’s progress throughout its lifecycle.
Prepare for Your Projects with a Planner
When you have a few different projects to manage at the same time, one clear overall view can help you manage everything better. For project management, this free Gantt Chart Planner template gives you the flexibility and features you’ll appreciate to drive your projects to success from initiation to closeout.

