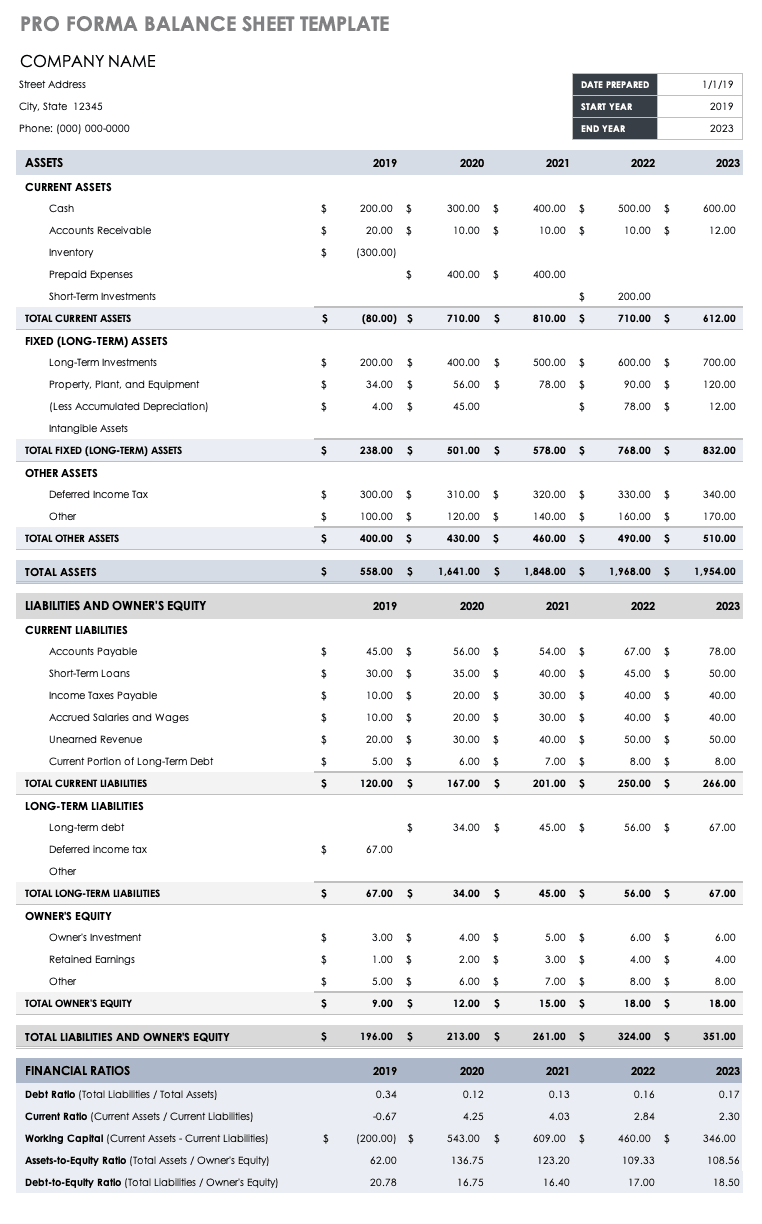
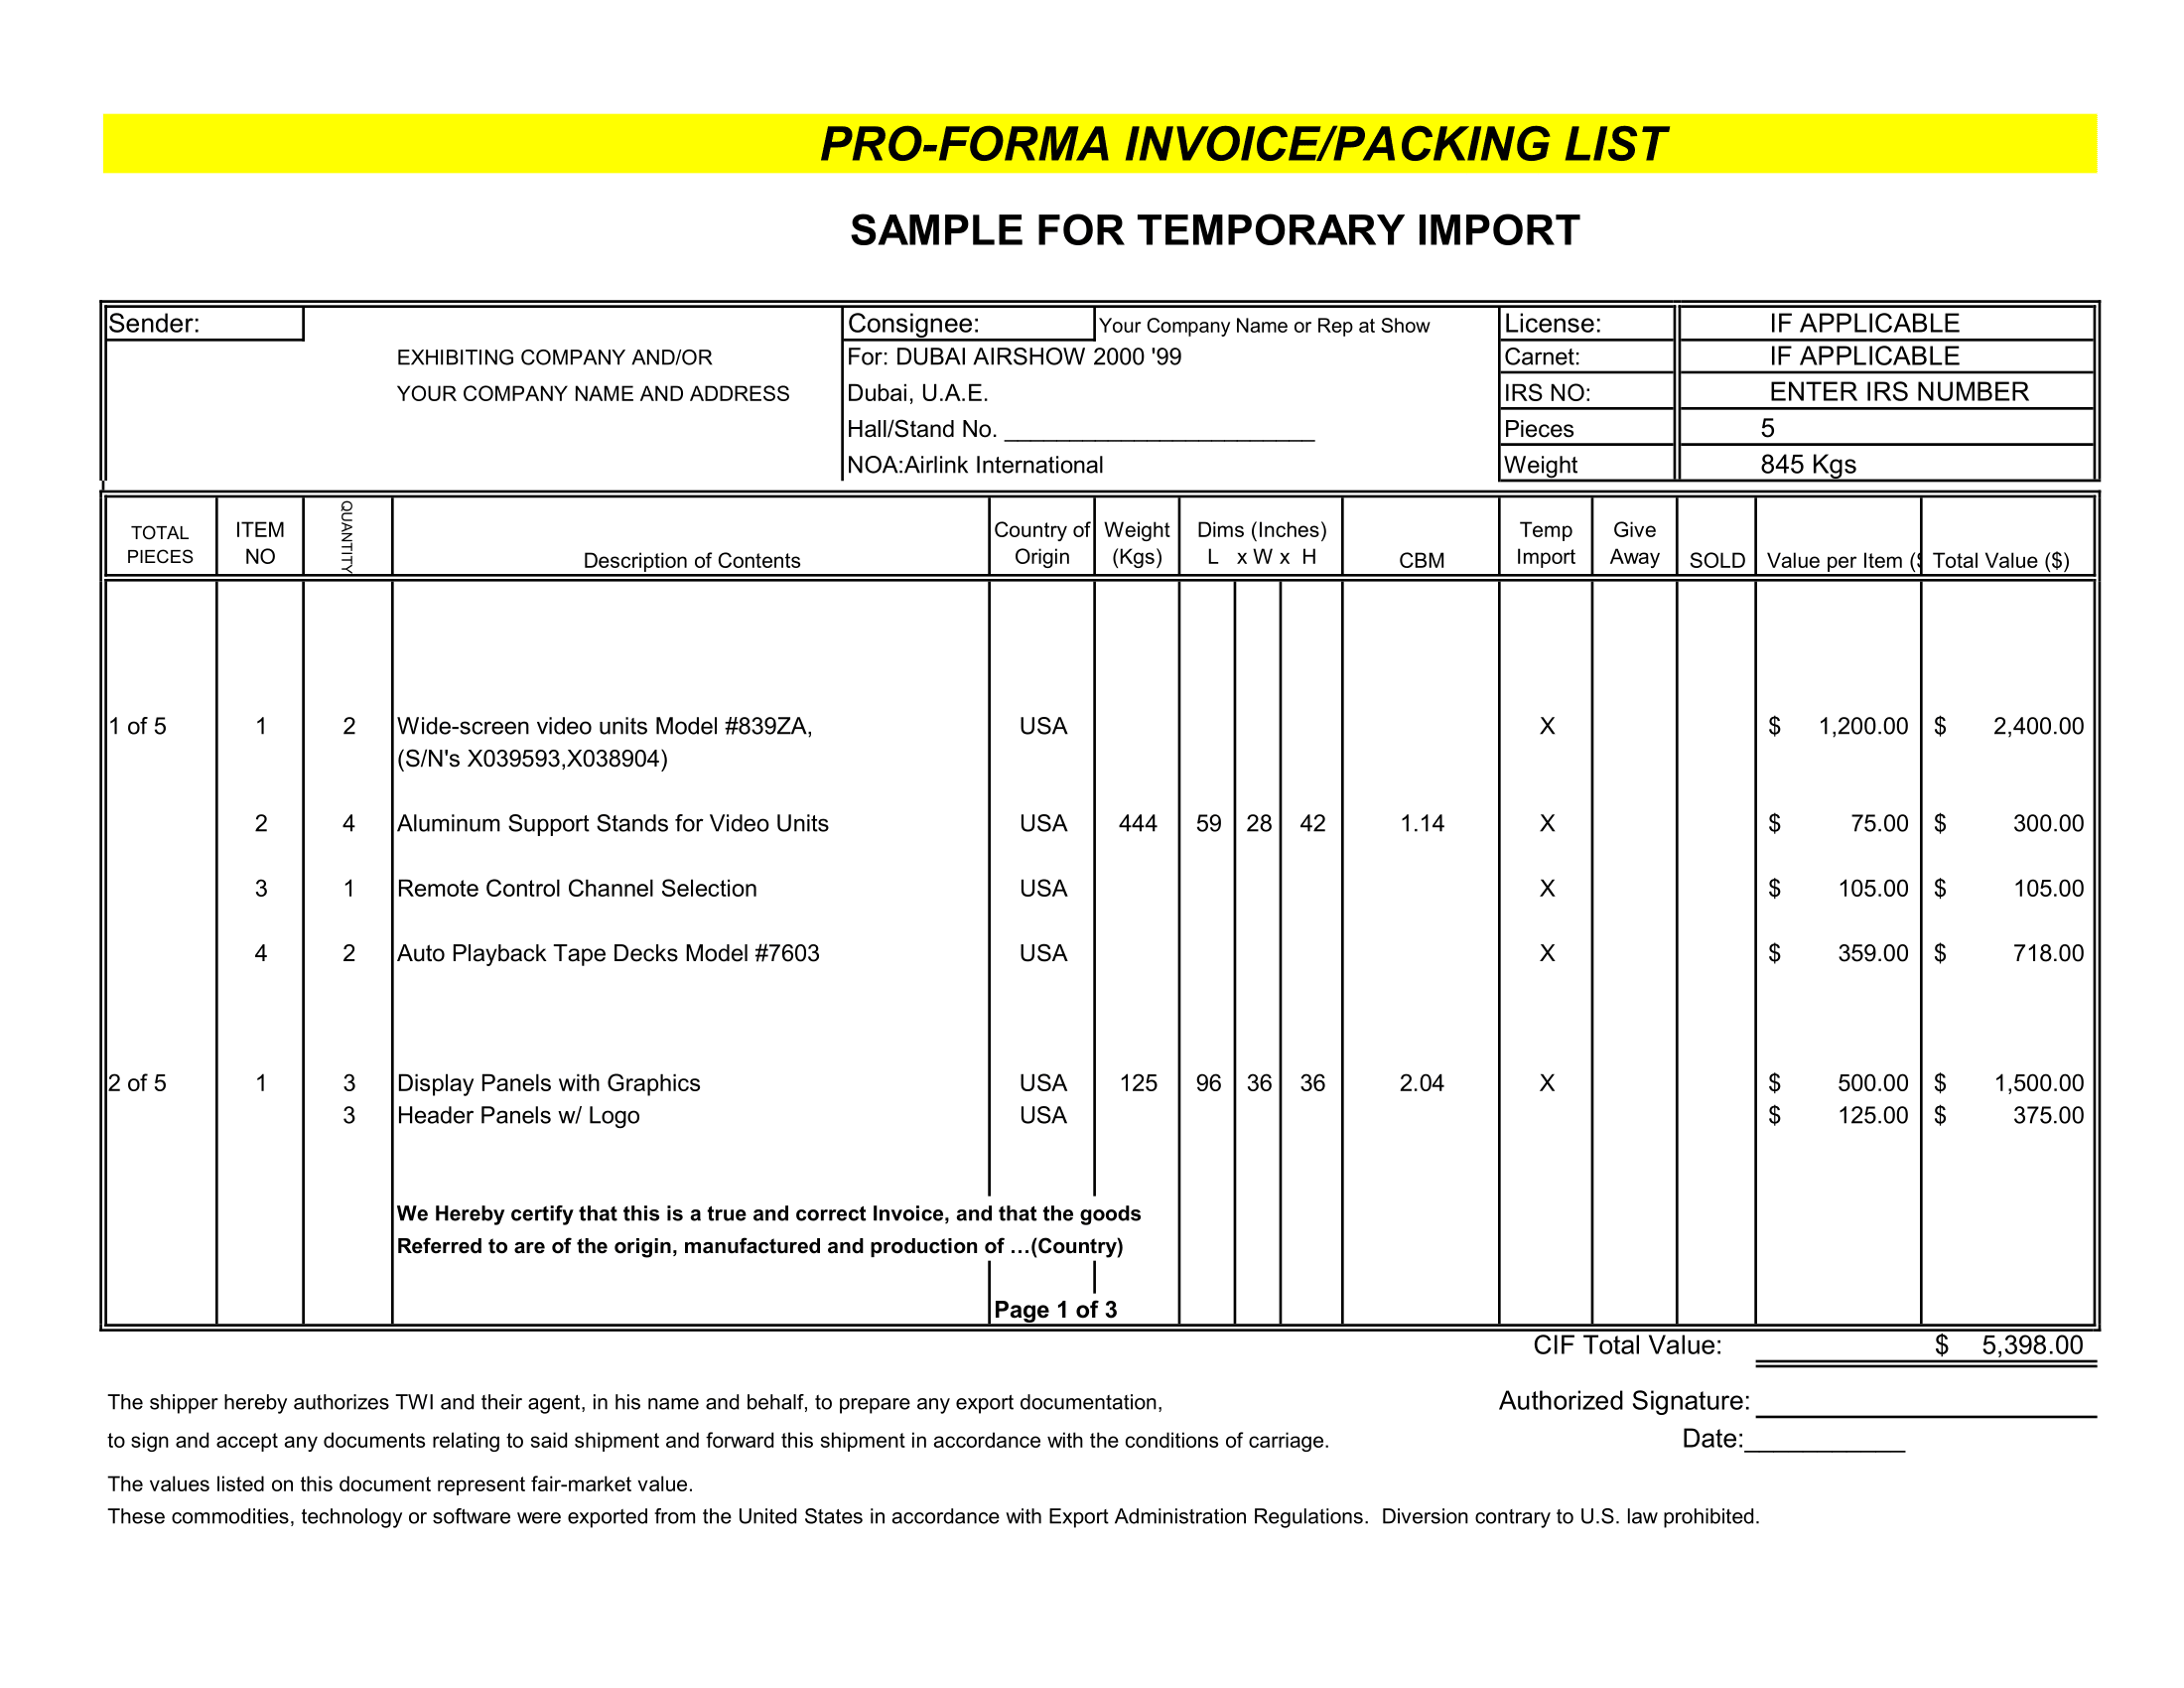
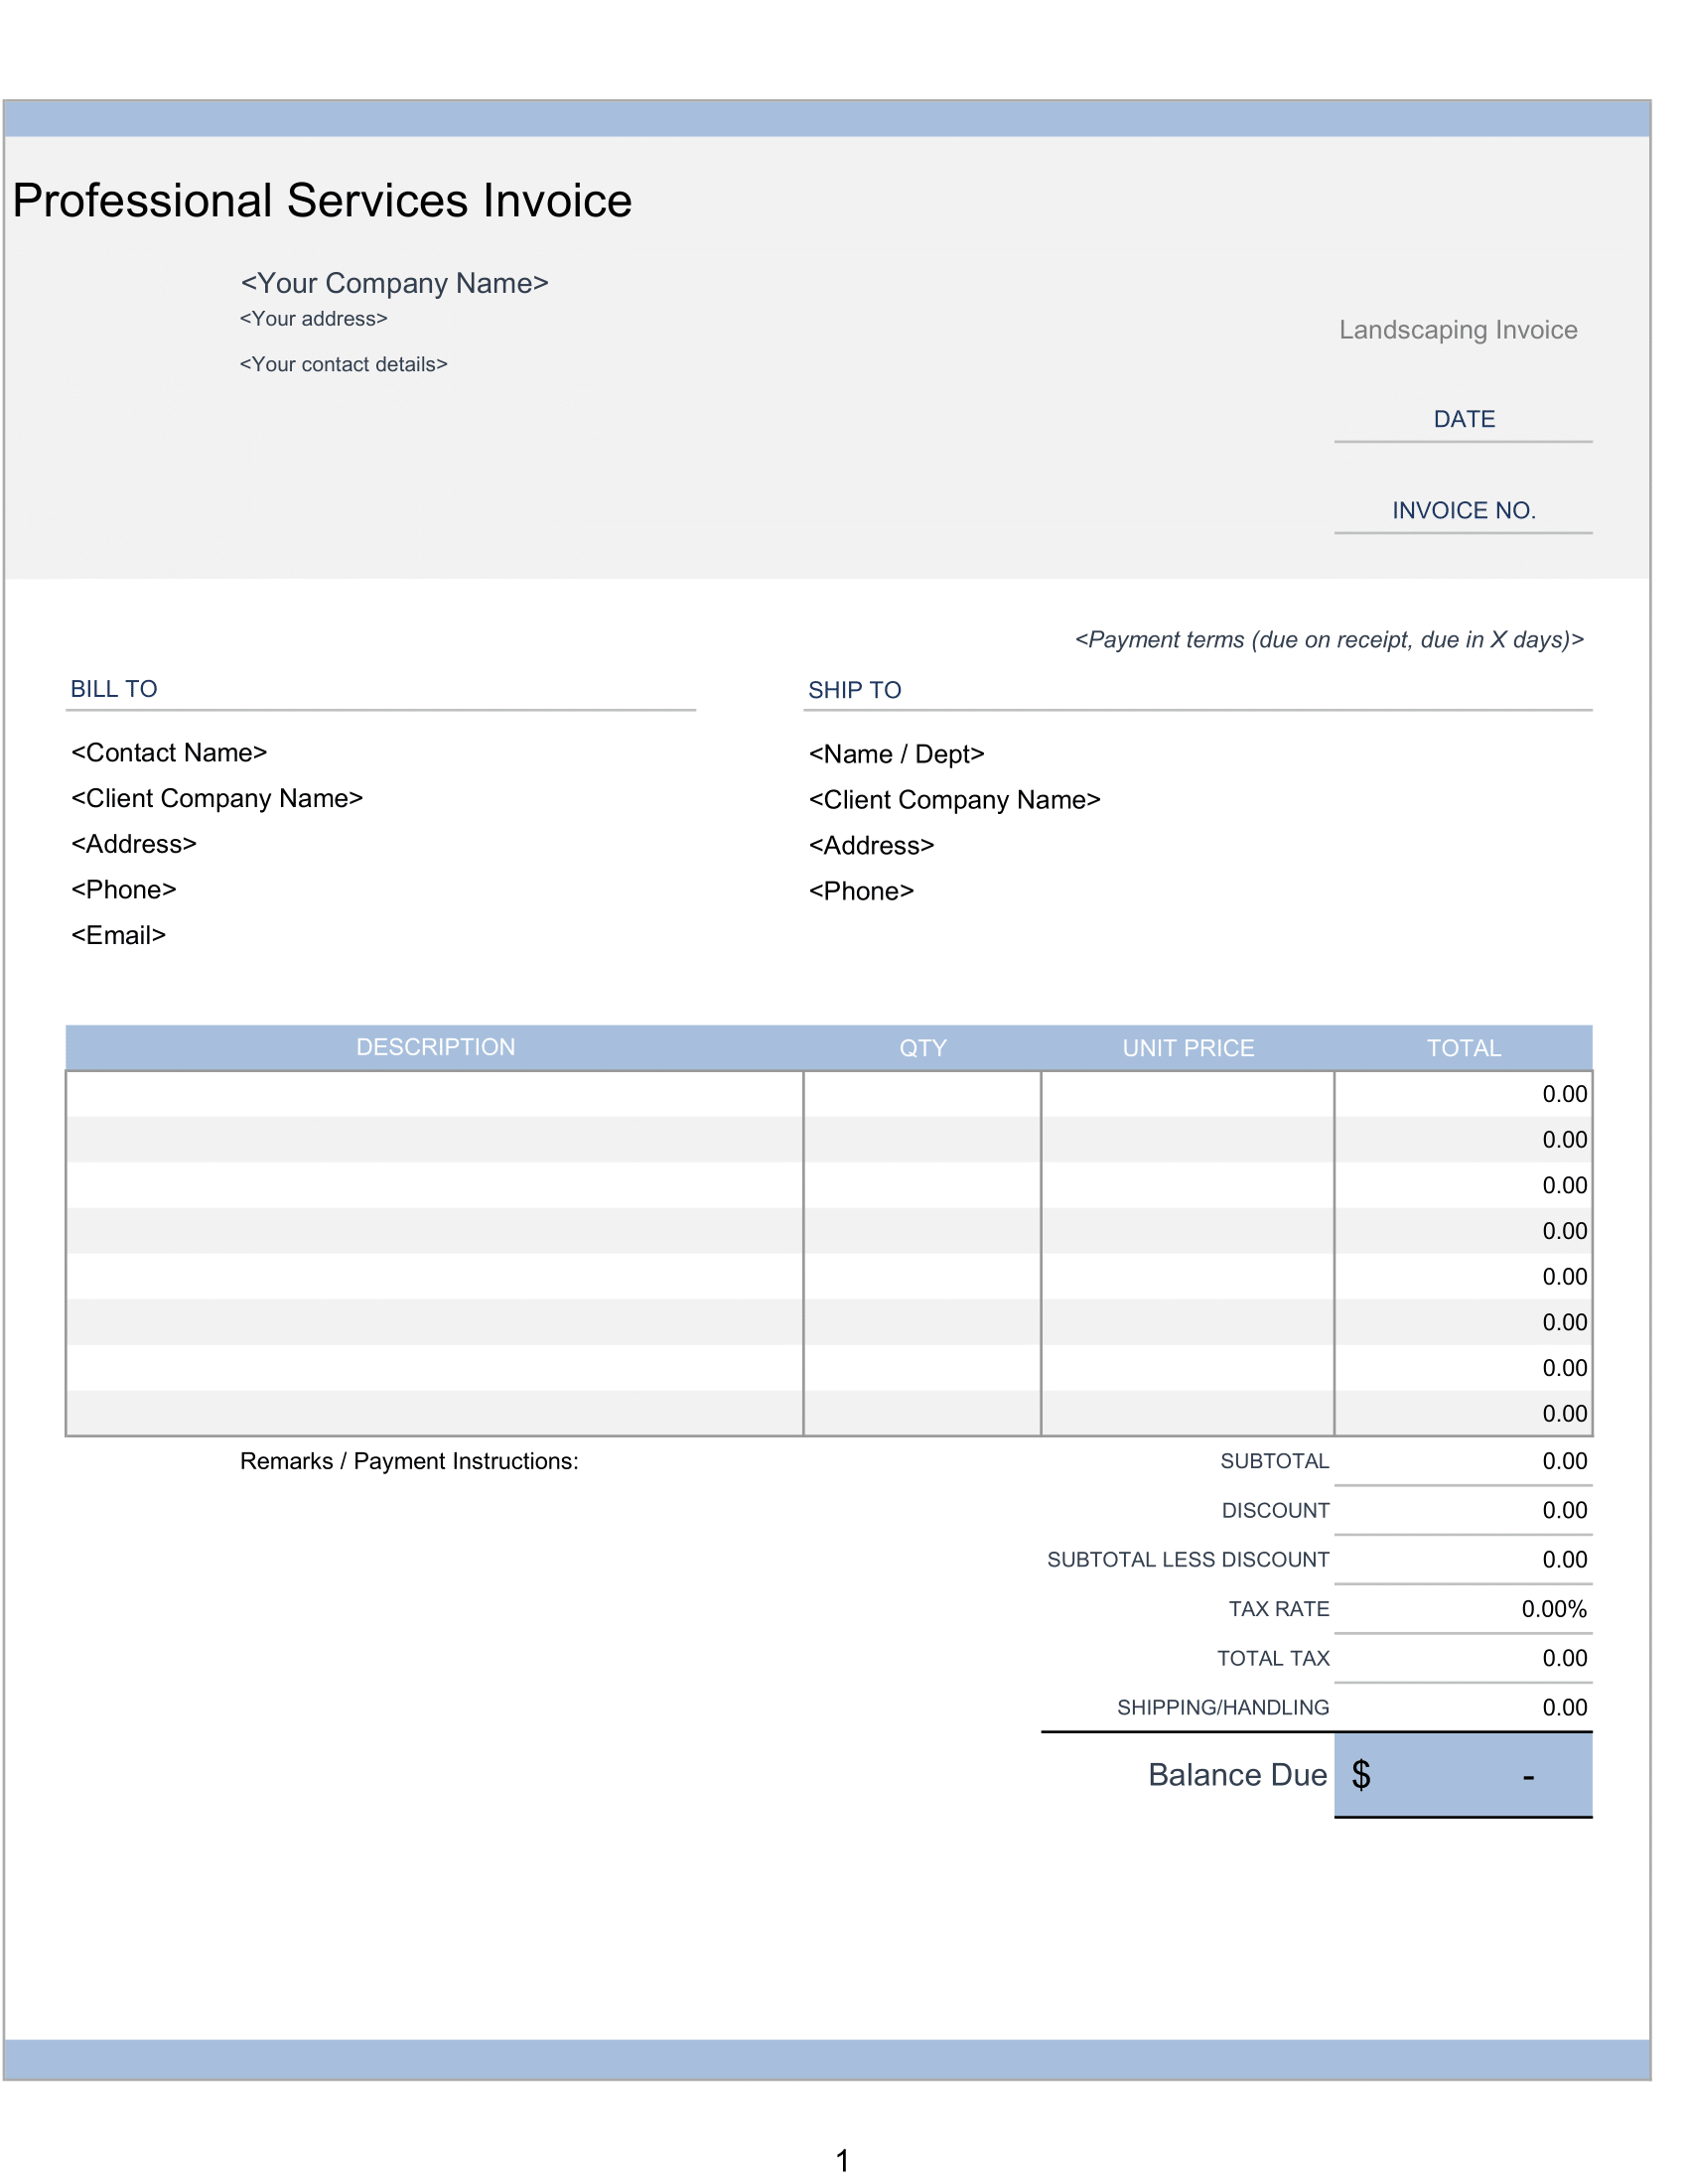
Use these free Pro forma balance sheet templates to convey the financial position of your business during a specific time period to potential investors and stakeholders.
Moreover, Small businesses can use this sheet template to project account balances for assets, liabilities, and equity for a designated period. So, Established businesses can use this template (and its built-in formulas) to calculate key financial ratios, including working capital.
How to Create a Pro-Forma Balance Sheet
- Firstly, Short Term Assets. The first two items will be your current cash assets and your accounts receivable. …
- Secondly, Long Term Assets. …
- Thirdly, Total Assets. …
- Fourthly, Liabilities. …
- Lastly, Final Tabulation
Is a pro forma the same as a balance sheet?
This is similar to a historical balance sheet, but it represents a future projection. Pro forma balance sheets are used to project how the business will be managing its assets in the future.
Benefits of creating a pro forma
Therefore, Financial models built on pro form projections contribute to the achievement of corporate goals if they: 1) test the goals of the plans; 2) furnish findings that are readily understandable; and 3) provide time, quality, and cost advantages over other methods.
Pro Forma Balance Sheet Example
Before creating your own pro forma balance sheet, take a look at our pro forma balance sheet sample:
So, Sample Business Plan Financials: Bob’s Rent-A-Bike
| Balance Sheets, Bob’s Rent-A-Bike | Starting | Pro forma | Pro forma | Pro forma | Pro forma | ||
| May 31 Year 1 | June 20 Year 1 | May 31 Year 2 | May 31 Year 3 | May 31 Year 4 | |||
| (interim period | |||||||
| to show max | |||||||
| Assets | cash need date) | ||||||
| Current Assets | |||||||
| Cash | 1000 | 1600 | 15672 | 35548 | 67160 | ||
| Inventory, Supplies | 200 | 500 | 800 | 1000 | 1200 | ||
| Total Current Assets | 1200 | 2100 | 16472 | 36548 | 68360 | ||
| Long-Term Assets | |||||||
| Depreciable Assets | 1500 | 7500 | 7500 | 12500 | 15500 | ||
| Accumulated Dep. (SL 60 mos) | 0 | 0 | 1500 | 4000 | 7100 | ||
| Net Long-Term Assets | 1500 | 7500 | 6000 | 8500 | 8400 | ||
| Total Assets | 2700 | 9600 | 22472 | 45048 | 76760 | ||
| -========== | -========== | -========== | -=========== | -========== | |||
| Liabilities & Equity | |||||||
| Current Liabilities | |||||||
| Accounts Payable | 200 | 600 | 1000 | 1300 | 1600 | ||
| Short-Term Debt | 0 | 0 | 0 | 0 | 0 | ||
| Total Current Liabilities | 200 | 600 | 1000 | 1300 | 1600 | ||
| Equity | |||||||
| Owner’s Paid-in Capital | 2500 | 2500 | 2500 | 2500 | 2500 | ||
| Owner’s Share Retained Earnings | -500 | 5736 | 16874 | 32580 | |||
| Investor’s Paid-in Capital | 7500 | 7500 | 7500 | 7500 | |||
| Investor’s Share Retained Earnings | -500 | 5736 | 16874 | 32580 | |||
| Total Equity | 2500 | 9000 | 21472 | 43748 | 75160 | ||
| Total Liabilities & Equity | 2700 | 9600 | 22472 | 45048 | 76760 | ||
| -========== | -========== | -========== | -========== | -========== | |||
| By June 20 Year 1 Pro Forma Expenditures and Investments: | |||||||
| Bicycle Assets | 7500 | ||||||
| Parts | 500 | ||||||
| Ads, etc. | 1000 | ||||||
| Total | 9000 | ||||||
| Less Accounts Payable | 600 | ||||||
| Projected Cash Usage | 8400 |

