A Gantt chart template for Excel is one of the best tools for project manager who can have in their collection.
You can do all of this and more with only a template, which is much faster and easier than creating a Gantt chart from scratch. After all, you don’t want to spend more time creating a Gantt chart than actual project takes, right?
Say hello to our Simple Gantt Chart Maker. This tool gives you best of both worlds when need to build a Gantt chart. It starts you with just the basics you need and lets you control the rest.
Easy Gantt Chart Maker
If you’ve come across this tool while searching Google for the right Gantt chart maker for you and your team, then you’ve likely seen other options for chart software.
Our Gantt chart creator is available for free with no hidden costs or subscriptions. You can use Excel’s sharing tools or one of your own to collaborate with the team, no matter how many teams or members you have. And finally, you can interact with Gantt chart you build from the first to the last day of your project.
Now let’s get to fun part! Here’s how to use the Simple Gantt Chart Maker.
File Download Contents
When you download our free Gantt chart maker, you’ll see two files:
- Simple Gantt Chart Maker with Completions by Day: Use this file to view your project by day and date. This works well for more detail projects when you need to track progress each day.
- Simple Gantt Chart Maker with Completions by Week: Use this file to view your project by week and week number. This works better for the high-level tracking view rather than a drilled-down Gantt chart view by day.
Gantt Chart Creator
You only have a few steps to perform with this Gantt chart generator to get started.
Enter the Project Start Date
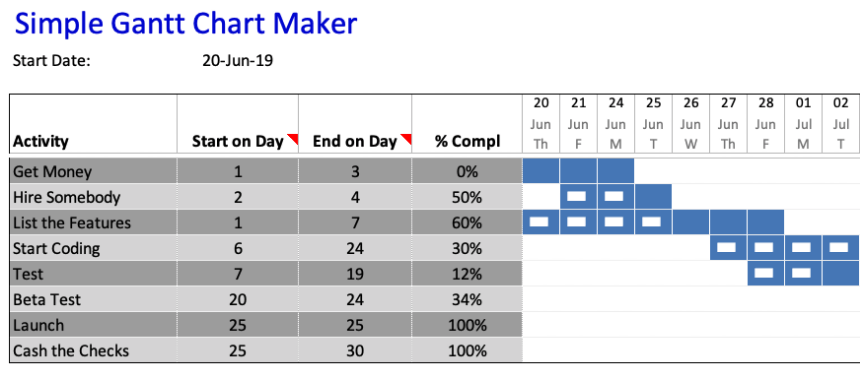
If you use a Simple Gantt Chart Maker with Completions by Day file, you’ll begin by entering the Start Date of your project on the top left. Once you enter that date, you’ll see the months, days, and dates adjust in Gantt chart view.
Add the Project Tasks
For both day and week completion files, you’ll next enter the project tasks. These go in the column labeled Activity. You can change name of this field if you prefer to Task, Assignment, or something similar
Insert the Start and End Day or Start and End Week
For each Activity, you’ll move on by entering when they are scheduled to begin and also end. For the Completions by Day file, insert the Start on Day and End on Day for each task. Since you entered the Start Date for the project already, you will only enter numbers for the Start on Day and End on the Day. This number will correspond to the Start Date.
Enter the Completions
The final column in work breakdown section is the Percent Complete (% Compl). When you receive updates from your project team on the progress for the tasks, you’ll enter numbers in this column. The column is formatted for percentage automatically, so just pop in a number.
Understanding the Gantt Chart View
The Gantt chart view on the right is the area that contains the calculations to display your project timeline. These calculations are based on the starts, ends, and completions you enter in the work breakdown section.
Customize Your Gantt Chart
For that control you were hoping for, you can change the appearance of many items in the chart. The only area you should leave intact is the chart view on the right and this is due to the built-in calculations.

