Download Triangular Graph Paper Template In Excel

Triangular graph paper is the most useful for graphing relationships between 3 data components (or variables) on a 3-sided triangular graph (or “Ternary Plot”). Since this is an equilateral triangle graph – each data component should be equal in value – usually 100% or 1. We offer triangular graph paper template, which allows you to create 3-sided graphs and other drawings, with ease.

Triangular Graph Contents

Here is list of worksheets included in this template.

(Triangular Graph) Portrait

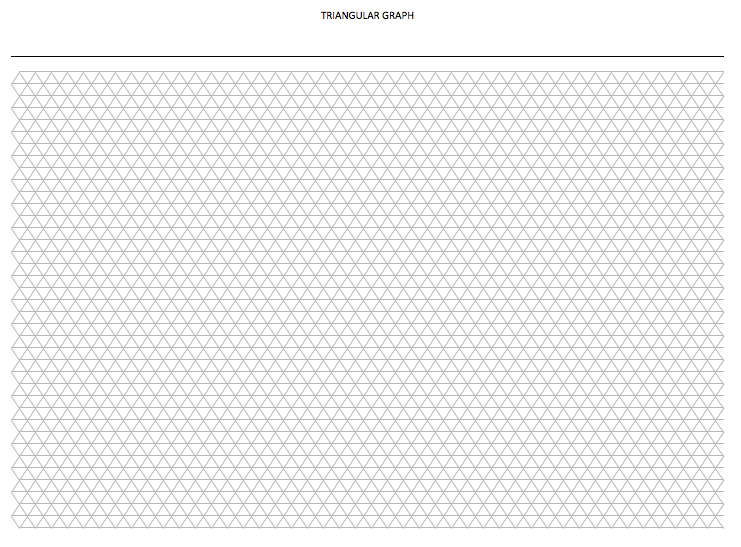
Graph paper composed of consequent equilateral triangles in portrait orientation.

(Triangular Graph) Landscape

Graph paper composes of consequent equilateral triangles in landscape orientation.

Using The Template

Personalize and Print

Each worksheet has a built-in header. Use header to include information, such as name, title, and date.

How to Plot Points

Each value between 3 variables can be plotted by following grid lines and then finding point where all 3 data points intersect.

Triangular Grid Graph

Drawing 3-sided Triangular Graphs

The triangular graph template is ideal for printing and drawing by hand, but working in Excel is also an option. You can draw a 3-sided triangular graph, scaled as you like, to show data with 3 components summarized in one triangular graph. Use the triangular grid lines as a guide for scale when drawing your chart.

To draw a 3-sided graph in Excel using our template – go to “Insert” menu and select “Illustrations”, and then select “Shapes”. Choose straight line from the “Lines” category to draw a 3-sided graph. One way to number the chart is to insert text boxes along each side of graph, number them, and make sure each side adds up to 100% or 1.

Customize

Modify Grid Scale

Our template contains consequent equilateral triangles with all sides roughly measuring 0.18 inches. But let’s say you find this scale a bit small and you’d like to triple current scale. Here’s how – take column width and row width and multiply by 3.

Highlight all the columns and right-click on any column. Select “Column Width” to enter a new column width. Repeat for all rows.

Modify Grid Units

Want to draw to scale using metric system, instead of the imperial system? You can modify the units originally displayed in the grid template by switching from inches to centimeters (or to millimeters). To do this – go to the “File” menu and select “Options”. Next, select “Advanced” and scroll down to the “Display” settings. Finally, select appropriate unit (e.g. Centimeters) from the “Ruler Units” dropdown menu. This will now allow you to modify grid scale in the newly selected unit of measure. To do modify scale, see above section “Modify Grid Scale”.

Add Some Color

Background graph paper color can be jazzed up just the way you like it. To modify graph paper background, select the area and use the “Fill Color” option, under the “Home” menu to charge the color of the grid.

Download this Triangular Graph Paper template in Excel Format

Our easy to use editable Excel templates and save your significant amount of time and effort. Here’s how to download and use one of our templates:

  1. Download this free Excel Template: Once you’ve browsed through our collection of templates and find the one that best fits your needs. Once you’ve found the template you want, click on the download button.

  2. Replace sample data with your actual data: Once the template is downloaded, open it in Excel. You’ll see that it is already set up with sample data. To start analyzing your own data, simply replace the sample data with your actual data.

  3. Customize the template: Our templates are completely editable, which means you can customize them to fit your specific needs. For example, you can change the formatting, add or remove columns, or create new charts and graphs.

  4. Use the Excel template: Once you’ve fed in your data and customized the template, you’re ready to start using it for data analysis. Use the various tools and features of Excel to analyze and visualize your data, and make informed business decisions.

  5. Save and share: Once you’ve finished working on the template, save it to your computer and share it with other members of your team or stakeholders as needed.

Click Download Button To Get Triangular Graph Paper Excel Template

Instruction :

All Excel templates and tools are sole property of xlsxtemplates.com. User can only download and use the excel templates for their Personal use only. All templates provided by XLSX templates are free and no payment is asked. However, you are not allowed to distribute or share in any other website for sole purpose of generating revenue from it.

 You can also download and use our 1000 Best PowerPoint Presentation Templates and 500 Resume Samples from PPTXTemplates.com  Completely Free. All our templates are designed by Professionals

Download Free Editable Excel Templates | Popular Templates

Sales Invoice With Tracker

Sales Invoice With Tracker

In today’s fast-paced business world, sales invoices aren’t just about demanding payment. They’re part of an integrated system that can help businesses track sales, manage

Read More »
Project Wise Invoice Format in Excel

Project Wise Invoice Format

Project Wise Invoice Format: Your Comprehensive Tool for Accurate Project Billing Projects, especially in industries like construction, IT, or consulting, can often span months or

Read More »
Proforma Invoice

Proforma Invoice

Proforma Invoice Template: Streamlining Your Pre-Transaction Communications While many businesses are familiar with standard invoices, the realm of proforma invoices, serving as a precursor to

Read More »
Professional Service Invoice

Professional Service Invoice

Professional Service Invoice: Tailored for Expert Service Providers The realm of professional services is vast, encompassing consultants, advisors, trainers, and many others. What ties all

Read More »

Free editable professional Excel templates can be a useful tool for businesses, organizations, and individuals looking to streamline their data management and reporting processes. These templates can provide a pre-designed and pre-formatted framework for storing and organizing data, as well as for creating charts, graphs, and other visualizations to help communicate that data more effectively.

One advantage of using professional Excel templates is that they are often designed by experienced professionals who understand best practices for data management and visualization. This means that the templates are likely to be well-organized, easy to understand, and aesthetically pleasing, which can make working with them more efficient and enjoyable.

Another advantage is that these templates are often fully editable, allowing users to customize them to meet the specific needs of their organization or project. This can include adding or deleting rows and columns, changing the formatting and layout, and adding custom formulas and functions.

Some examples of professional Excel templates that may be available for free include budgeting templates for personal or business use, project management templates for tracking tasks and deadlines, and sales tracking templates for analyzing and forecasting sales data. There are also a wide variety of templates available for specific industries, such as real estate, marketing, human resource, Payroll management and among others.

Overall, free editable professional Excel templates can be a valuable resource for anyone looking to improve their data management and analysis skills. By providing a pre-designed and customizable framework for storing, organizing, and visualizing data, these templates can help users save time and make more informed decisions.