Streamlining Your Supply Chain Management with a Multi-functional Dashboard in Excel Sheet
The supply chain is undoubtedly one of the most complex facets of any business. It’s an interplay of several elements, all of which contribute to the effective functioning of your organization. The key to managing this complexity is effective visualization and robust data analysis. And what better tool to help than the humble Excel?
In this blog post, we will guide you through a powerful supply chain dashboard template in Excel. Most importantly, This template is not merely a static set of data; it is a dynamic and automated tool designed to track key supply chain metrics. Basically, It’s like having your very own supply chain analyst right on your desktop.
The dashboard comprises three main sheets: a data sheet, a calculation sheet, and the main show – an automated dashboard. In the following sections, we will dive deeper into each of these components.
1. Data Sheet – Your Supply Chain’s Data Repository
The Data Sheet is the initial building block of our dashboard template. It acts as the repository where all raw supply chain data is stored. This includes relevant information such as supplier details, defect rates, product availability, lead times, delivery schedules, and supplier assessment scores.
In essence, the data sheet forms the bedrock upon which the other two components of the dashboard – the calculation sheet and the dashboard itself – are built. The more accurate and comprehensive the data, the more precise and useful your dashboard will be.
2. Calculation Sheet – The Number Cruncher
Next in line is the Calculation Sheet, the brain behind the dashboard. This sheet takes the raw data from the data sheet and crunches the numbers, performing the necessary calculations to turn raw data into actionable insights.
Metrics such as defect rate, availability, lead time, supplier-wise assessment, and timely delivery assessment are computed here. These metrics provide valuable insights into the performance of your supply chain, helping you identify areas of improvement, potential bottlenecks, and opportunities for optimization.
3. Automated Dashboard – Your Personal Supply Chain Analyst
The third and final component of our Excel dashboard is the Automated Dashboard Sheet. This is where the magic happens!
The dashboard is designed to auto-populate based on the month you select. This means you can track the performance of your supply chain in real-time, with the dashboard updating automatically to reflect the latest data.
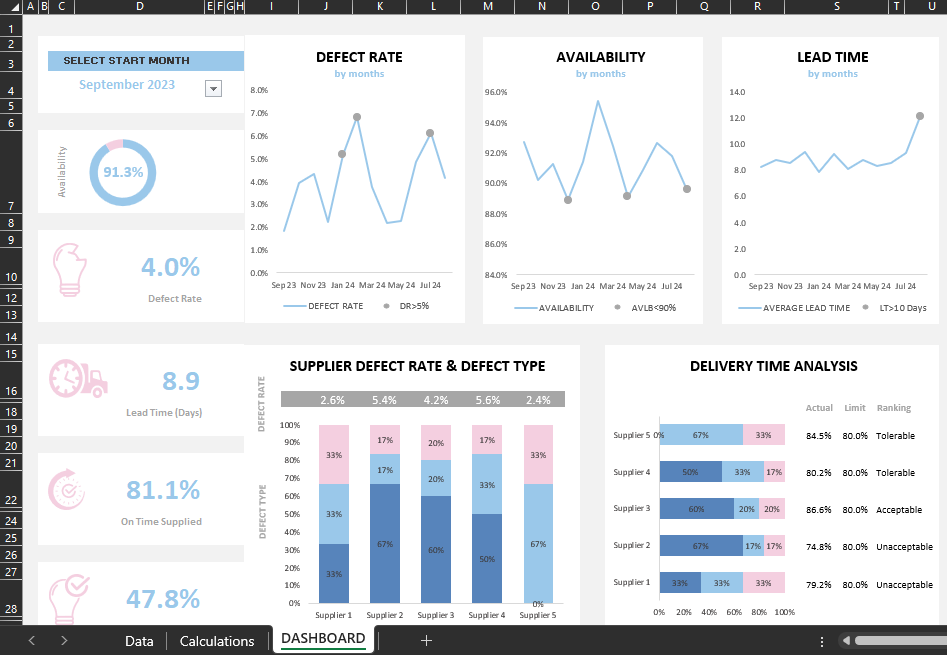
The dashboard displays several key metrics for easy viewing and analysis:
a) Defect Rate
The dashboard calculates and displays the defect rate, helping you to keep an eye on the quality of the goods or services provided by your suppliers. High defect rates may indicate a problem with a specific supplier or a need for improved quality control measures.
b) Availability
Product availability is another critical metric shown on the dashboard. A high availability rate means that your supply chain is running smoothly and that products are readily available to meet customer demand.
c) Lead Time
Lead time, the period from when an order is placed until it is received, is another metric included on the dashboard. Monitoring lead time helps to ensure efficient operations and customer satisfaction.
d) Supplier-Wise Assessment
The supplier-wise assessment allows you to evaluate the performance of each supplier individually. This is crucial for identifying the most and least reliable suppliers and making informed decisions about future collaborations.
e) Timely Delivery Assessment
Finally, the dashboard includes a timely delivery assessment. This tracks whether deliveries from suppliers are arriving as scheduled, an essential factor for maintaining operational efficiency and meeting customer expectations.
In conclusion, our dynamic Excel supply chain dashboard template is a powerful tool for monitoring and optimizing your supply chain operations. By combining raw data, complex calculations, and
an automated, user-friendly interface, this template provides a comprehensive overview of your supply chain performance in real-time.
4. The Power of Excel in Supply Chain Management
At first glance, Excel may seem like a simple spreadsheet program, but with the right knowledge and techniques, it can be transformed into a powerful business tool. This dynamic, automated supply chain dashboard is a perfect example of Excel’s capabilities.
By leveraging Excel’s inherent functionalities – like its extensive range of formulas, PivotTables, and data visualization tools – we can create a dashboard that not only displays key supply chain metrics but also allows us to delve deeper into our data and uncover valuable insights.
Excel is not only flexible and versatile but also universally accessible, making it an excellent tool for businesses of all sizes. With our supply chain dashboard template, you can take control of your supply chain management, driving efficiency and effectiveness in your operations.
5. Getting Started with Your Supply Chain Dashboard in Excel. Download now!
To get started with your supply chain dashboard, all you need is your data and our Excel template. Enter your raw data into the Data Sheet, and the Calculation Sheet will do the rest of the work, processing this data and feeding it into the Automated Dashboard.
From there, simply select the month you wish to view, and your dashboard will update automatically, displaying the latest metrics for your supply chain. With this tool, you can track performance, identify trends, and make data-driven decisions to improve your supply chain operations.
6. Conclusion – Optimizing Supply Chain with Data
In an increasingly data-driven business world, it’s essential to harness the power of data in every aspect of your operations, including supply chain management. With our Excel supply chain dashboard template, you can transform raw data into actionable insights, empowering you to optimize your supply chain for maximum efficiency and effectiveness.
Remember, managing a supply chain is not just about monitoring performance; it’s about analyzing data, identifying trends, and leveraging these insights to make informed decisions. With our supply chain dashboard, you’re not just keeping an eye on your supply chain; you’re mastering it.