Download Free Financial Dashboard in Excel: A Powerful Tool for Revenue Insights
Welcome to the fascinating world of Excel, where data meets design! Today, we’re going to dive into a fundamental tool for financial analysis and strategic decision-making: the Financial Dashboard.
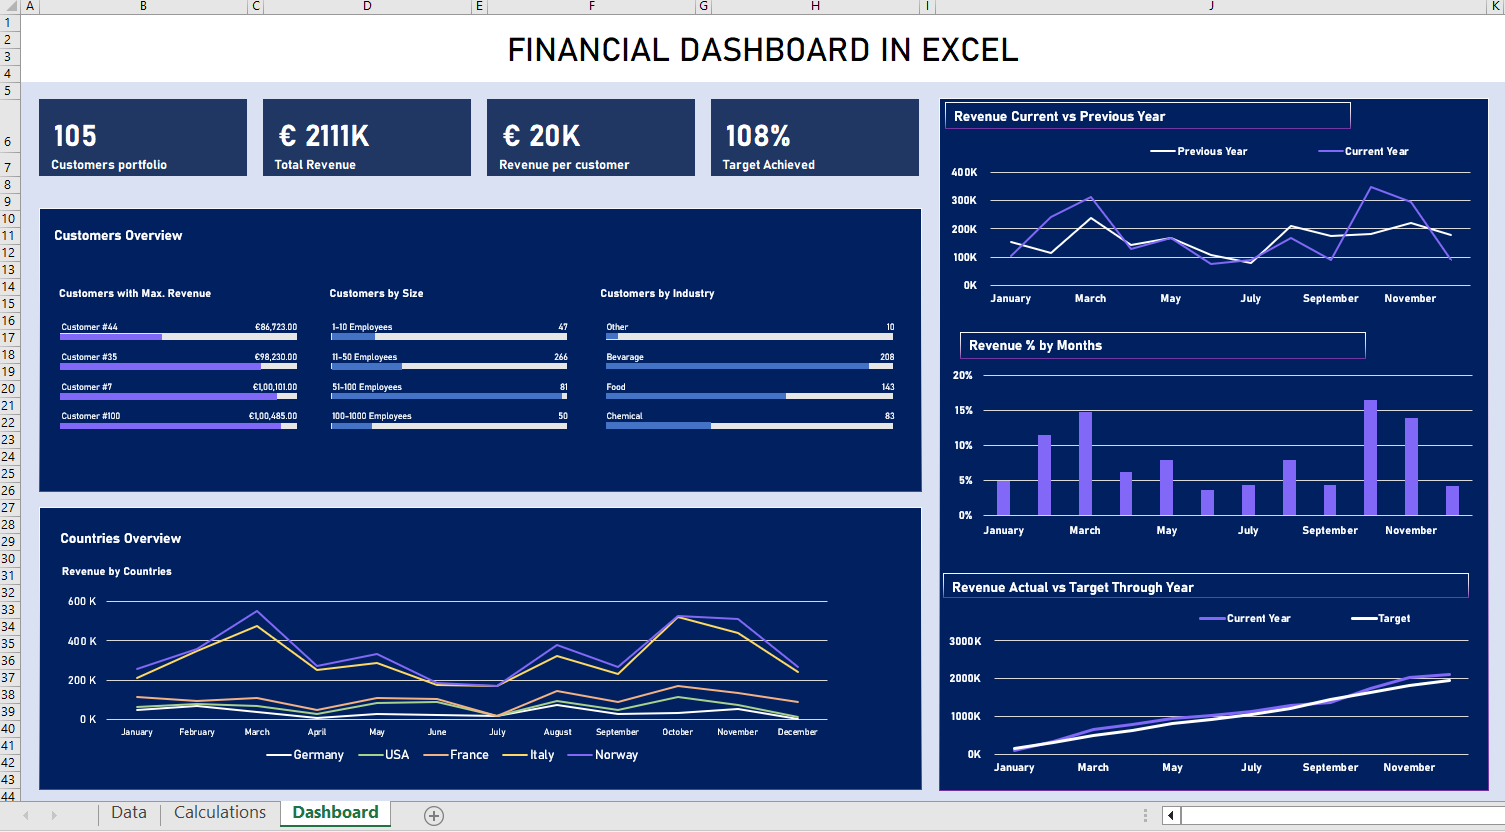
Our custom-made, interactive financial dashboard template provides valuable insights on various revenue parameters. It allows you to analyze revenue growth, year-on-year revenue trends, monthly revenue growth, budget vs actual revenue, country-wise revenue, and customer-wise insights – all in one place.
The best part? It’s automated. You enter the data manually in a separate sheet, and the dashboard updates itself once refreshed. This magic happens through the power of Excel formulas and references. Let’s delve deeper into how this works.
1. Getting Started with Your Financial Dashboard
This dashboard is designed with simplicity and user-friendliness in mind. Here’s a quick overview of the different sections of the dashboard:
- Revenue Growth Analysis: Shows the overall growth of revenue over a specified period.
- Year on Year Revenue Trend Analysis: Compares the yearly revenue performance.
- Monthly Revenue Growth Chart: Gives a detailed monthly revenue progression.
- Budget vs. Actual Revenue Growth Chart: Compares projected revenue versus actual performance.
- Country-wise Revenue Graph: Provides a geographical breakdown of your revenue.
- Customer-wise Insights: Gives you revenue details per customer, which helps identify key clients or markets.
2. The Power of Automation
The magic behind the dashboard’s automation is Excel’s powerful formulas and references. The dashboard pulls data from a separate data input sheet. When you update the input sheet with new data and refresh the dashboard, it updates automatically, reflecting the latest data in your reports and graphs.
3. Populating the Data Input Sheet
The data input sheet is where you manually enter your data. This sheet is divided into relevant sections like Revenue, Date, Budget, Country, and Customer.
To enter data:
- Open the input sheet.
- Enter your data in the respective fields. For example, you’d enter the revenue amount in the Revenue column, the corresponding date in the Date column, and so on.
Remember, the accuracy of your dashboard relies on the accuracy of the data entered in the input sheet.
4. Refreshing Your Dashboard
After you’ve entered all the necessary data into the input sheet, it’s time to update your dashboard:
- Navigate to the dashboard sheet.
- Refresh the dashboard. This could be as simple as closing and reopening the workbook or, in some versions, you may need to click on the
Refreshbutton in theDatatab on the ribbon.
Voila! Your dashboard will now reflect the latest data from your input sheet.
5. Reading Your Financial Dashboard
Now that your data is up to date, you can analyze your financial insights. Hover over any data point or chart to see more details. You can filter data in various sections depending on your requirements.
Remember, this dashboard is a tool for insights, and its effectiveness depends on how you interpret and act on those insights. So, spend some time with it, explore the data, look for trends, gaps, and opportunities.
6. Excel Financial Dashboard – Troubleshooting Tips
Like all tools, the Excel Financial Dashboard might present you with some challenges. Here are a few troubleshooting tips that could come in handy:
- Dashboard not updating? Check the links between the dashboard and data input sheet to ensure they’re intact.
- Error in calculations? Check your formulas and ensure you’ve entered data in the correct fields.
- Issues with the display? Check your Excel settings. Sometimes, issues like these are as simple as adjusting your Excel views.
7. Customizing Your Financial Dashboard
One of the most compelling features of an Excel dashboard is its customization potential. You can tweak your dashboard to mirror the specific requirements of your business. You can add or delete sections, alter calculations, or change the visual style to fit your brand’s aesthetics.
Remember to always keep a backup of your original dashboard template before making any changes.
10. Download Your Free Excel Financial Dashboard Template
It’s time to put theory into practice. To help you get started on this exciting journey of data analysis, we’re offering a free Excel Financial Dashboard template.
Our template is pre-loaded with all the features we’ve discussed: revenue growth analysis, year-on-year revenue trend, monthly revenue growth chart, budget vs actual comparison, country-wise revenue breakdown, and customer-wise insights. This carefully designed, automated template is ready to use — just download, populate with your data, and refresh to see the magic happen!
To download your free Excel Financial Dashboard template, click on the link provided. Remember, the first step towards powerful data analysis is getting started, and there’s no better time than now.
Don’t forget to share your experiences and insights with us once you start using the template. We’re excited to hear about your journey with Excel dashboards!
Happy analyzing and until next time, excel in Excel!